Direct Investment by Country and Industry for 2021
The U.S. Bureau of Economic Analysis (BEA) recently released statistics on direct investment by country and industry for 2021. These statistics cover both U.S. direct investment abroad (USDIA, or outward investment) and foreign direct investment in the United States (FDIUS, or inward investment). The statistics cover positions (or cumulative stock of investment), financial transactions, and income, as well as their components, and are obtained from mandatory surveys of direct investment conducted by BEA.
The following charts present highlights of BEA's direct investment by country and industry statistics for 2021. Much more detail, including additional data items, can be found on the BEA website.
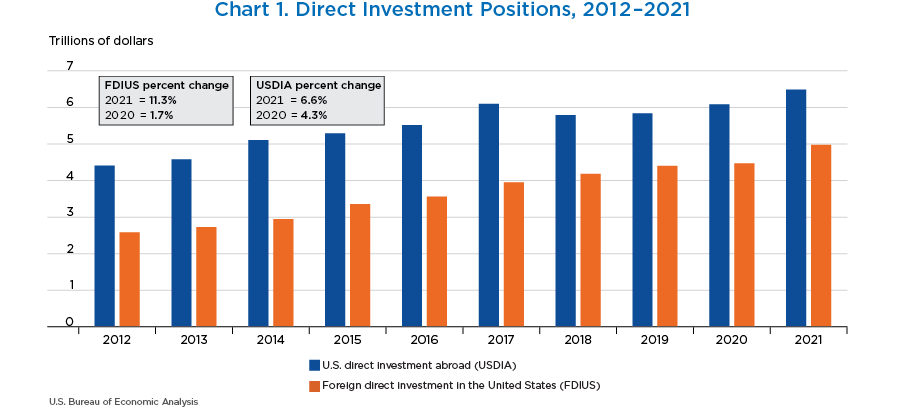
- The U.S. direct investment abroad position (shown in the blue bars) increased $403.3 billion, or 6.6 percent, to $6.49 trillion at the end of 2021 from $6.09 trillion at the end of 2020.
- The inward direct investment position (shown in the orange bars) increased $506.1 billion, or 11.3 percent, to $4.98 trillion at the end of 2021 from $4.47 trillion at the end of 2020.
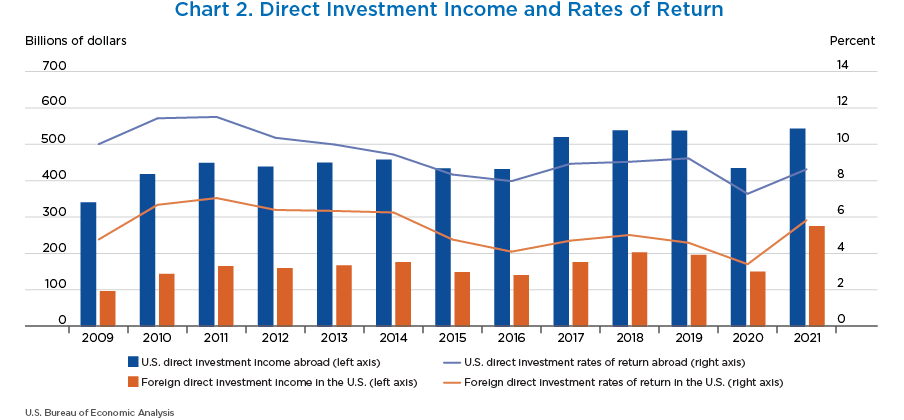
- In 2021, U.S. multinationals earned $542.3 billion on their investments abroad (shown in the blue bars), up 25.0 percent from the $433.7 billion earned in 2020.
- Foreign multinationals earned $275.3 billion on their U.S. investments in 2021 (shown in the orange bars), up 82.4 percent from $150.9 billion in 2020.
- The rate of return for outward investment was 8.6 percent in 2021 (shown in the blue line), while the inward rate of return was 5.8 percent (shown in the orange line).
- 2021 marks the first time the rates of return have been less than 3 percent apart.
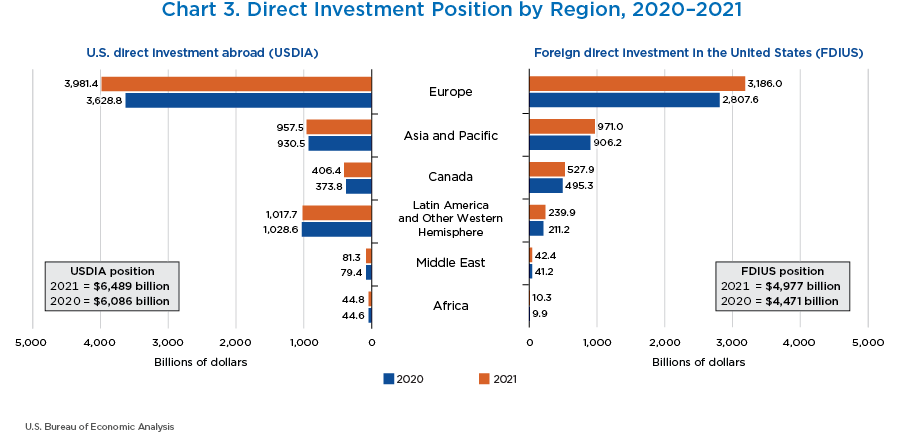
- The value of U.S. direct investment abroad (shown on the left) increased in every region except Latin America in 2021. The value of foreign direct investment in the United States (shown on the right) increased from every region.
- Europe was the largest source and destination of U.S. direct investment, accounting for 60 percent of U.S. direct investment abroad position and 64 percent of foreign direct investment position in the United States.
- By region, the largest increase for both U.S. direct investment abroad and foreign direct investment into the United States was Europe.
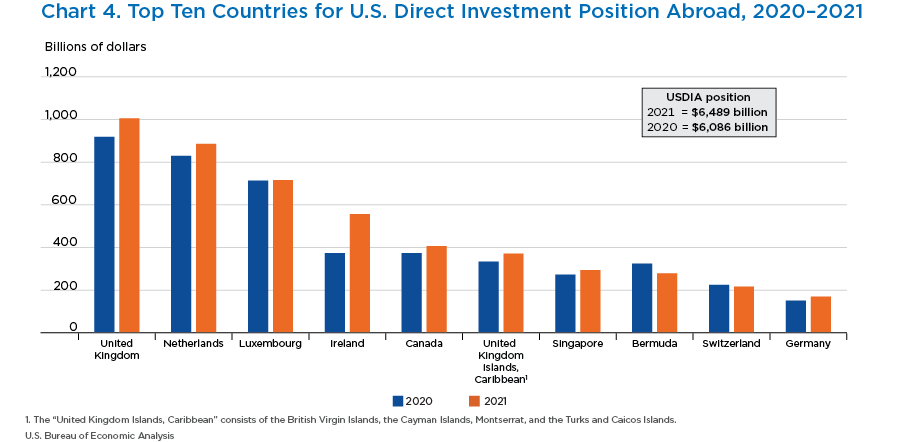
- The top 10 host countries accounted for more than 75 percent of the U.S. direct investment abroad position in 2021.
- The U.S. direct investment abroad position was the largest in the United Kingdom ($1.0 trillion), followed by the Netherlands ($885.3 billion) and Luxembourg ($715.6 billion).
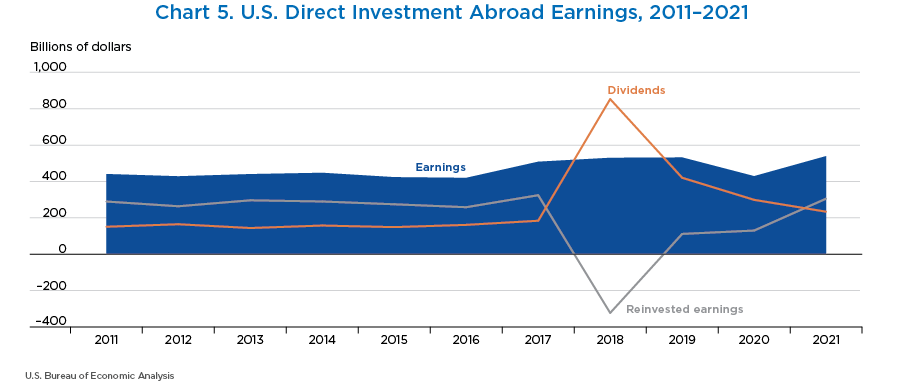
- In 2018, U.S. multinationals repatriated a record $853.4 billion from their foreign affiliates as a result of the Tax Cuts and Jobs Act of 2017, which generally eliminated taxes on dividends, or repatriated earnings, to U.S. multinationals from their foreign affiliates. The elevated repatriation of earnings continued through 2019 and 2020 but returned to a more normal level in 2021.
- In 2021, U.S. multinationals repatriated $233.9 billion from their affiliates abroad, down from $299.1 billion in 2020.
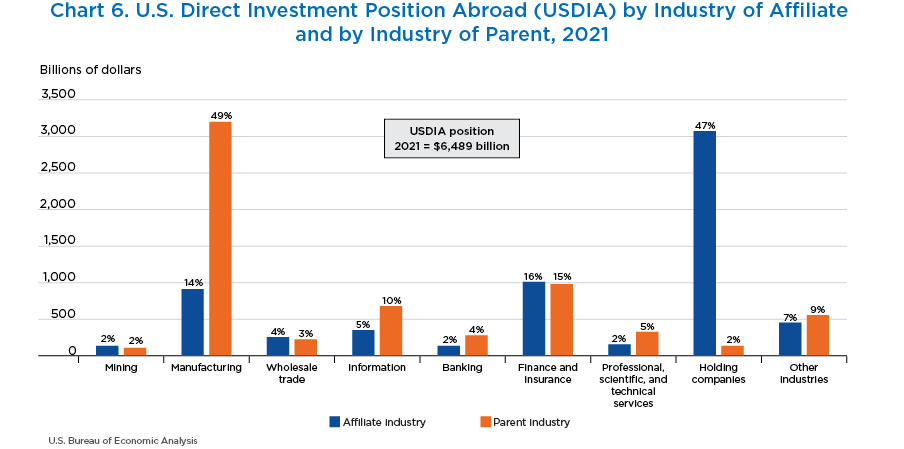
- U.S. parent companies invest in a variety of industries, but nearly half of the overall U.S. direct investment abroad position is in holding companies. These companies own other foreign affiliates that operate in a variety of industries.
- By industry of the U.S. parent, investment by manufacturing multinationals accounted for 49.3 percent of the position, followed by multinationals in finance and insurance (15.1 percent).
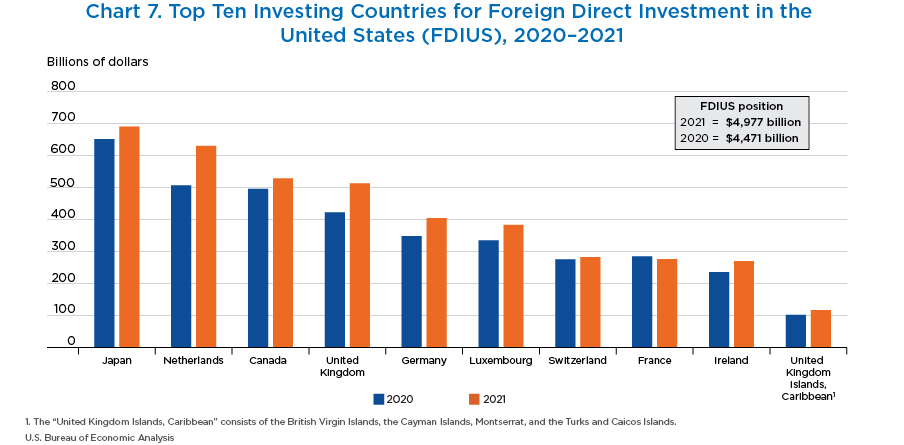
- The top 10 investing countries accounted for 82 percent of the foreign direct investment position in the United States. The top five investing countries accounted for more than half of the total position.
- Japan was the top investing country in 2021, with a position of $690.0 billion.
- The Netherlands had the largest increase, increasing 24.3 percent to $629.5 billion.
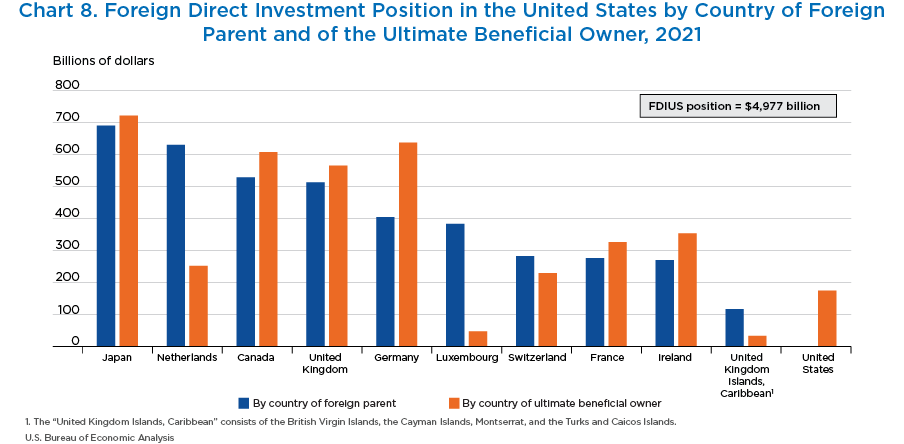
- Multinational enterprises can have complex ownership structures. To provide a more complete picture of these structures, BEA produces two sets of statistics on the ownership of foreign direct investment in the United States. The first, by country of foreign parent, focuses on the country of the immediate investor. The second, by country of the ultimate beneficial owner (UBO), shows where the ultimate owner of the U.S. affiliate is located.
- Multinationals from Japan tend to own their U.S. affiliates directly, and the Japanese position by country of foreign parent, $690.0 billion, and by country of UBO, $721.0 billion, are relatively close in value.
- When the orange bar is significantly higher than the blue bar, such as Germany, companies from these countries are passing their investments through other entities in the ownership chain before they enter the United States. The German position by country of the foreign parent was $403.6 billion in 2021, much lower than by country of UBO at $636.5 billion.
- When the blue bar is significantly higher than the orange bar, such as Luxembourg and the Netherlands, companies in these countries often act as pass-through entities for multinationals based in other countries. The Luxembourg position by country of foreign parent, $382.9 billion, is much greater than the position by country of UBO, $46.6 billion.
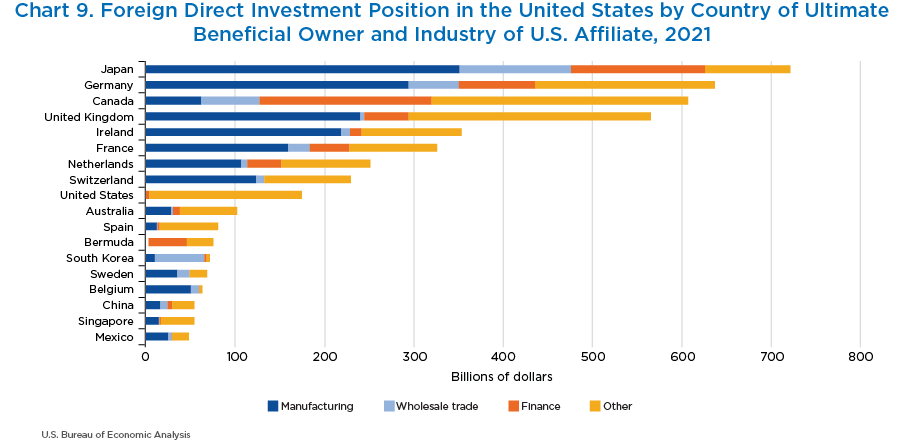
- By country of UBO, the top 10 countries account for 80 percent of the foreign direct investment position in the United States. Japan had the largest position, with $721.0 billion in 2021, followed by Germany ($636.5 billion) and Canada ($607.3 billion).
- Japanese and German multinationals primarily invest in the U.S. manufacturing sector, with manufacturing affiliates accounting for 48.7 percent and 46.2 percent of their investments, respectively.
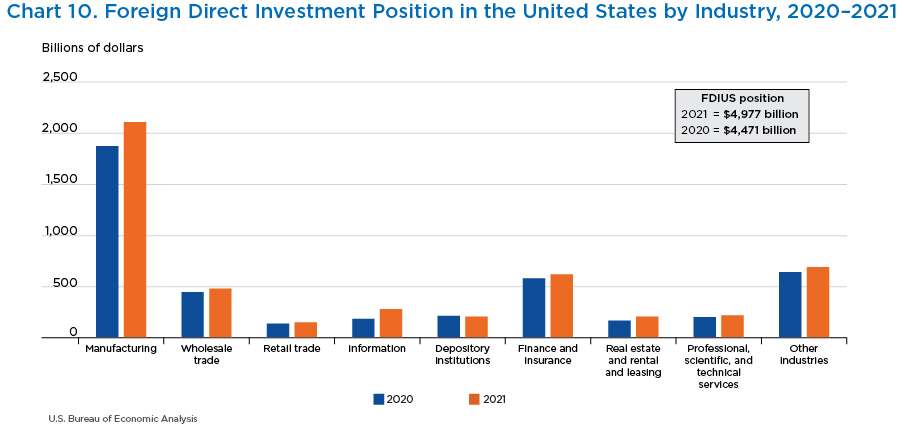
- In 2021, manufacturing accounted for the largest proportion of the foreign direct investment position in the United States, with 42.4 percent, or $2.1 trillion.
- Finance and insurance was second, with 12.5 percent, or $620.6 billion, and wholesale trade was third, with 9.7 percent, or $483.3 billion.
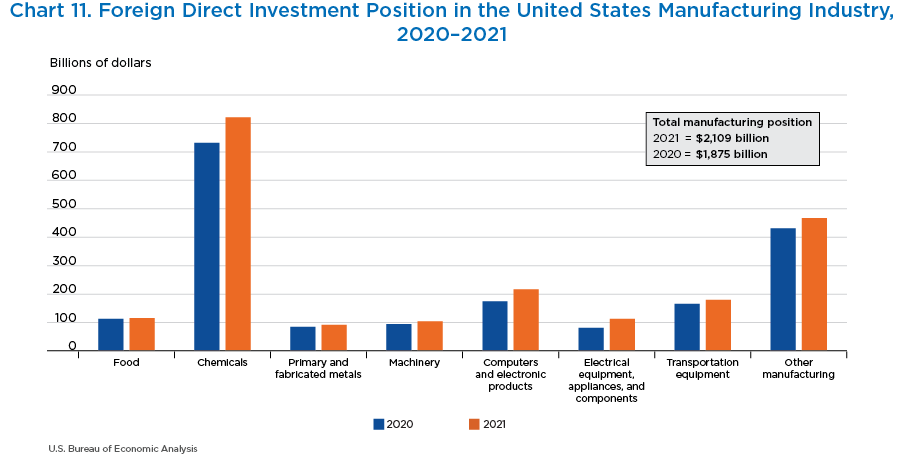
- Within manufacturing, the largest share of foreign direct investment was in chemicals, accounting for 38.9 percent of the total investment in the sector.
- Pharmaceutical manufacturing comprises two-thirds of the foreign direct investment position in chemical manufacturing.
