
GDP and the Economy
Second Estimates for the Third Quarter of 2022
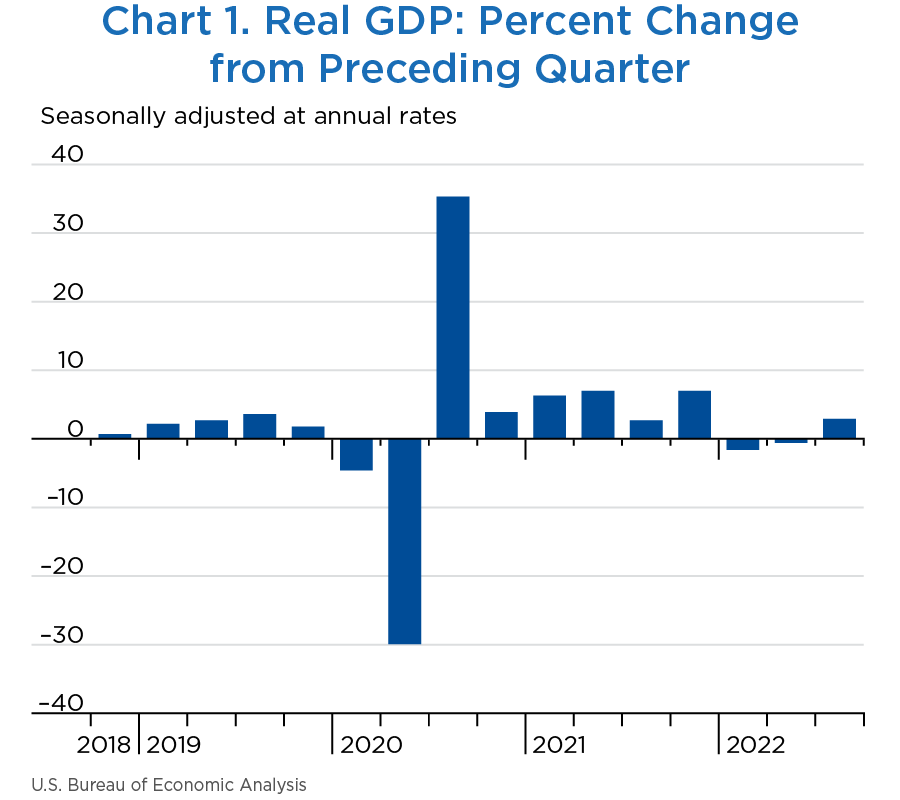
Real gross domestic product (GDP) increased at an annual rate of 2.9 percent in the third quarter of 2022, according to the “second” estimates of the National Income and Product Accounts (NIPAs) (chart 1 and table 1).1 In the second quarter, real GDP decreased 0.6 percent. With the second estimate, real GDP growth was revised up 0.3 percentage point from the advance estimate issued last month.
[Click chart to expand]
[Click chart to expand]
The upturn in real GDP in the third quarter, compared to the second quarter, primarily reflected a smaller decrease in private inventory investment, an acceleration in nonresidential fixed investment, and upturns in federal government as well as state and local government spending that were partly offset by a larger decrease in residential fixed investment and a deceleration in consumer spending. Imports turned down. For more details, including source data, refer to the “Technical Note.”
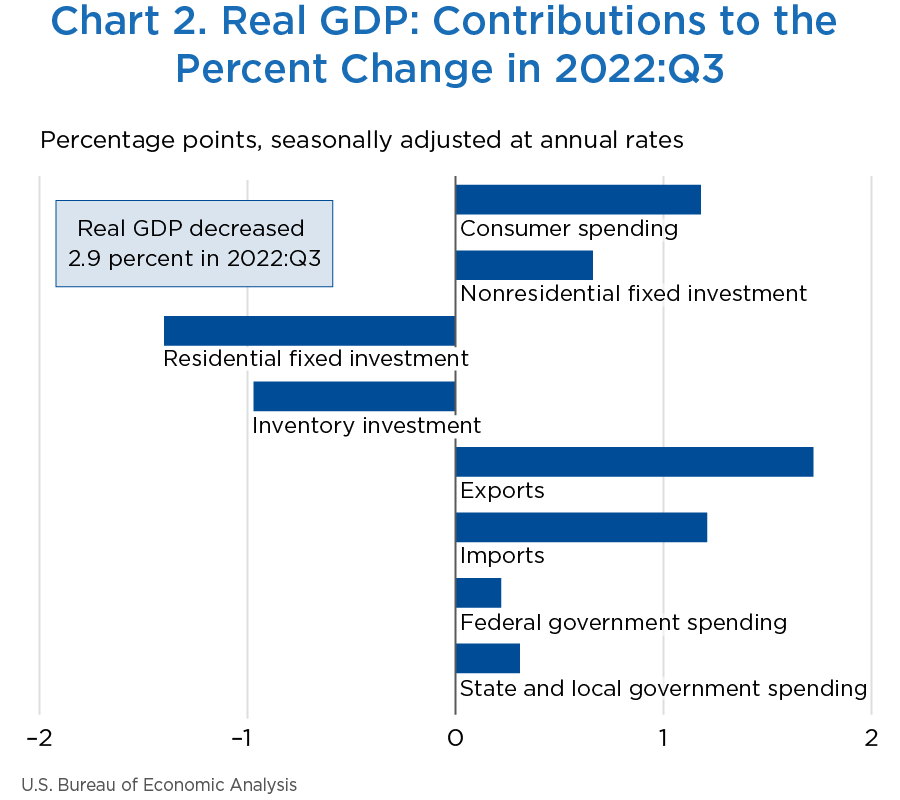
The 2.9 percent increase in real GDP reflected increases in exports, consumer spending, nonresidential fixed investment, state and local government spending, and federal government spending that were partly offset by decreases in residential fixed investment and private inventory investment. Imports, which are a subtraction in the calculation of GDP, decreased (chart 2 and table 1).2
- The increase in exports reflected increases in both goods and services. Within exports of goods, the leading contributors to the increase were industrial supplies and materials (notably, nondurable goods), “other” exports of goods, and nonautomotive capital goods. Within exports of services, the increase was led by travel and “other” business services (mainly financial services).
- Within consumer spending, an increase in services (led by health care and “other” services) was partly offset by a decrease in goods (led by motor vehicles and parts as well as food and beverages).
- Within nonresidential fixed investment, increases in equipment and intellectual property products were partly offset by a decrease in structures.
- The increase in state and local government spending was led by increases in compensation of state and local government employees and investment in structures.
- The increase in federal government spending was led by defense spending.
- Within residential fixed investment, the leading contributors to the decrease were new single-family construction and brokers' commissions.
- The decrease in private inventory investment was led by retail trade (mainly clothing and accessory stores as well as “other” retailers).
- Within imports, a decrease in imports of goods (notably, consumer goods) was partly offset by an increase in imports of services (mainly travel).
| Line | Series | Share of current-dollar GDP (percent) | Change from preceding period (percent) | Contribution to percent change in real GDP (percentage points) | ||||||
|---|---|---|---|---|---|---|---|---|---|---|
| 2022 | 2021 | 2022 | 2021 | 2022 | ||||||
| Q3 | Q4 | Q1 | Q2 | Q3 | Q4 | Q1 | Q2 | Q3 | ||
| 1 | Gross domestic product (GDP)1 | 100.0 | 7.0 | −1.6 | −0.6 | 2.9 | 7.0 | −1.6 | −0.6 | 2.9 |
| 2 | Personal consumption expenditures | 68.2 | 3.1 | 1.3 | 2.0 | 1.7 | 2.14 | 0.91 | 1.38 | 1.18 |
| 3 | Goods | 23.3 | 2.3 | −0.1 | −2.6 | −0.2 | 0.55 | −0.02 | −0.61 | −0.04 |
| 4 | Durable goods | 8.6 | 5.1 | 7.6 | −2.8 | −0.3 | 0.44 | 0.64 | −0.24 | −0.03 |
| 5 | Nondurable goods | 14.8 | 0.7 | −4.4 | −2.5 | −0.1 | 0.12 | −0.66 | −0.37 | −0.01 |
| 6 | Services | 44.8 | 3.5 | 2.1 | 4.6 | 2.7 | 1.58 | 0.93 | 1.99 | 1.22 |
| 7 | Gross private domestic investment | 17.8 | 32.0 | 5.4 | −14.1 | −9.1 | 5.14 | 0.98 | −2.83 | −1.71 |
| 8 | Fixed investment | 17.5 | 0.6 | 4.8 | −5.0 | −4.1 | 0.12 | 0.83 | −0.92 | −0.74 |
| 9 | Nonresidential | 13.2 | 1.1 | 7.9 | 0.1 | 5.1 | 0.17 | 0.98 | 0.01 | 0.66 |
| 10 | Structures | 2.5 | −12.7 | −4.3 | −12.7 | −6.9 | −0.35 | −0.11 | −0.34 | −0.18 |
| 11 | Equipment | 5.3 | 1.6 | 11.4 | −2.0 | 10.7 | 0.10 | 0.55 | −0.11 | 0.53 |
| 12 | Intellectual property products | 5.4 | 8.1 | 10.8 | 8.9 | 5.8 | 0.42 | 0.54 | 0.46 | 0.31 |
| 13 | Residential | 4.3 | −1.1 | −3.1 | −17.8 | −26.8 | −0.05 | −0.15 | −0.93 | −1.40 |
| 14 | Change in private inventories | 0.3 | … | … | … | … | 5.01 | 0.15 | −1.91 | −0.97 |
| 15 | Net exports of goods and services | −3.5 | … | … | … | … | −0.16 | −3.13 | 1.16 | 2.93 |
| 16 | Exports | 11.9 | 23.5 | −4.6 | 13.8 | 15.3 | 2.37 | −0.53 | 1.51 | 1.72 |
| 17 | Goods | 8.3 | 23.4 | −7.2 | 15.5 | 17.7 | 1.62 | −0.58 | 1.18 | 1.38 |
| 18 | Services | 3.6 | 23.6 | 1.6 | 9.9 | 9.9 | 0.74 | 0.06 | 0.33 | 0.34 |
| 19 | Imports | 15.4 | 18.6 | 18.4 | 2.2 | −7.3 | −2.53 | −2.60 | −0.35 | 1.21 |
| 20 | Goods | 12.7 | 19.6 | 20.4 | −0.4 | −9.1 | −2.20 | −2.38 | 0.05 | 1.25 |
| 21 | Services | 2.7 | 14.0 | 9.1 | 16.6 | 1.5 | −0.33 | −0.22 | −0.41 | −0.04 |
| 22 | Government consumption expenditures and gross investment | 17.5 | −1.0 | −2.3 | −1.6 | 3.0 | −0.16 | −0.40 | −0.29 | 0.53 |
| 23 | Federal | 6.4 | 0.0 | −5.3 | −3.4 | 3.4 | 0.01 | −0.36 | −0.22 | 0.22 |
| 24 | National defense | 3.6 | −5.3 | −8.5 | 1.4 | 4.4 | −0.20 | −0.33 | 0.05 | 0.16 |
| 25 | Nondefense | 2.8 | 7.4 | −1.1 | −9.2 | 2.1 | 0.21 | −0.03 | −0.28 | 0.06 |
| 26 | State and local | 11.0 | −1.6 | −0.4 | −0.6 | 2.8 | −0.17 | −0.04 | −0.06 | 0.31 |
| Addenda: | ||||||||||
| 27 | Gross domestic income (GDI)2 | … | 6.7 | 0.8 | −0.8 | 0.3 | … | … | … | … |
| 28 | Average of GDP and GDI | … | 6.8 | −0.4 | −0.7 | 1.6 | … | … | … | … |
| 29 | Final sales of domestic product | … | 1.9 | −1.8 | 1.3 | 4.0 | … | … | … | … |
| 30 | Goods | 31.8 | 18.6 | −5.4 | −3.0 | 8.2 | 5.52 | −1.76 | −0.96 | 2.54 |
| 31 | Services | 59.9 | 3.2 | 1.0 | 3.1 | 3.2 | 1.91 | 0.57 | 1.83 | 1.88 |
| 32 | Structures | 8.3 | −5.2 | −4.9 | −15.3 | −16.1 | −0.47 | −0.44 | −1.44 | −1.49 |
- The GDP estimates under the contribution columns are also percent changes.
- GDI is deflated by the implicit price deflator for GDP.
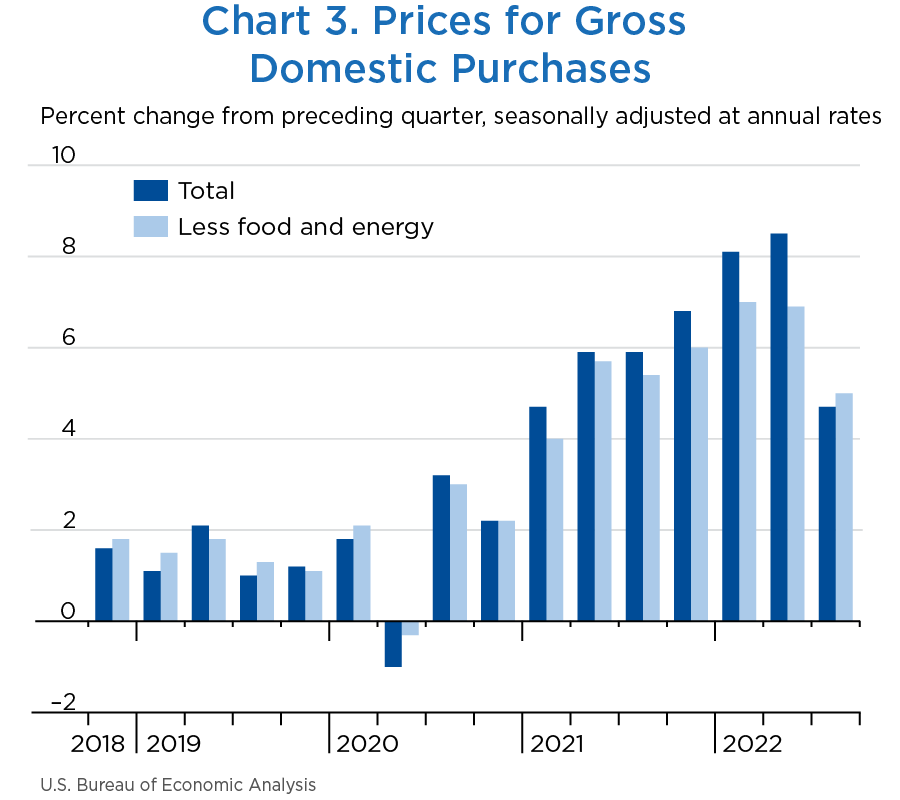
BEA's featured measure of inflation in the U.S. economy, the price index for gross domestic purchases (goods and services purchased by U.S. residents), increased 4.7 percent in the third quarter after increasing 8.5 percent in the second quarter (table 2 and chart 3). Price increases were widespread across all major expenditure categories and were led by increases in consumer goods and services.
- Within goods, the leading contributors to the price increase were food and beverages for off-premises consumption (groceries), “other” nondurable goods (led by recreational items, pharmaceutical and other medical products, personal care products, and household supplies), and motor vehicles and parts (mainly new light trucks). These increases were partly offset by a decrease in the prices paid for gasoline and other energy goods (mainly motor vehicle fuels).
- Within services, price increases were widespread across most categories. The leading contributor was housing and utilities (mainly the imputed rental of owner-occupied nonfarm housing). Prices for financial services and insurance decreased, primarily reflecting a decrease in prices paid for portfolio management and investment advice services.
Within gross domestic purchases, food prices increased 13.4 percent in the third quarter after increasing 14.7 percent in the second quarter. Prices for energy goods and services decreased 13.1 percent after increasing 53.6 percent. Gross domestic purchases prices excluding food and energy increased 5.0 percent after increasing 6.9 percent.
Consumer prices excluding food and energy, a measure of the “core” rate of inflation, increased 4.6 percent in the third quarter after increasing 4.7 percent in the second quarter.
[Click chart to expand]
| Line | Series | Change from preceding period (percent) | Contribution to percent change in gross domestic purchases prices (percentage points) | ||||||
|---|---|---|---|---|---|---|---|---|---|
| 2021 | 2022 | 2021 | 2022 | ||||||
| Q4 | Q1 | Q2 | Q3 | Q4 | Q1 | Q2 | Q3 | ||
| 1 | Gross domestic purchases1 | 6.8 | 8.1 | 8.5 | 4.7 | 6.8 | 8.1 | 8.5 | 4.7 |
| 2 | Personal consumption expenditures | 6.2 | 7.5 | 7.3 | 4.3 | 4.10 | 4.90 | 4.81 | 2.81 |
| 3 | Goods | 9.3 | 12.6 | 10.6 | 2.7 | 2.06 | 2.76 | 2.37 | 0.64 |
| 4 | Durable goods | 8.2 | 8.3 | 2.4 | 3.5 | 0.68 | 0.70 | 0.22 | 0.29 |
| 5 | Nondurable goods | 9.9 | 15.2 | 15.7 | 2.3 | 1.38 | 2.07 | 2.15 | 0.35 |
| 6 | Services | 4.6 | 4.9 | 5.6 | 5.1 | 2.04 | 2.13 | 2.44 | 2.18 |
| 7 | Gross private domestic investment | 8.8 | 9.9 | 9.9 | 7.6 | 1.49 | 1.77 | 1.76 | 1.29 |
| 8 | Fixed investment | 8.8 | 10.0 | 10.3 | 7.6 | 1.48 | 1.68 | 1.72 | 1.27 |
| 9 | Nonresidential | 7.7 | 6.9 | 8.5 | 7.5 | 0.94 | 0.87 | 1.06 | 0.93 |
| 10 | Structures | 22.8 | 16.7 | 17.5 | 19.9 | 0.52 | 0.39 | 0.40 | 0.45 |
| 11 | Equipment | 6.5 | 7.6 | 9.2 | 5.8 | 0.31 | 0.38 | 0.45 | 0.29 |
| 12 | Intellectual property products | 2.1 | 1.9 | 3.9 | 3.7 | 0.11 | 0.10 | 0.20 | 0.19 |
| 13 | Residential | 12.0 | 18.9 | 15.2 | 8.1 | 0.54 | 0.82 | 0.66 | 0.34 |
| 14 | Change in private inventories | … | … | … | … | 0.01 | 0.09 | 0.03 | 0.02 |
| 15 | Government consumption expenditures and gross investment | 7.2 | 8.7 | 11.6 | 3.7 | 1.22 | 1.45 | 1.90 | 0.63 |
| 16 | Federal | 4.3 | 5.7 | 6.0 | 5.1 | 0.28 | 0.36 | 0.38 | 0.32 |
| 17 | National defense | 4.5 | 6.6 | 7.5 | 3.0 | 0.16 | 0.23 | 0.26 | 0.10 |
| 18 | Nondefense | 4.2 | 4.5 | 4.1 | 8.0 | 0.12 | 0.13 | 0.12 | 0.21 |
| 19 | State and local | 9.0 | 10.6 | 15.0 | 2.9 | 0.94 | 1.09 | 1.52 | 0.31 |
| Addenda: | |||||||||
| Gross domestic purchases: | |||||||||
| 20 | Food | 8.8 | 11.2 | 14.7 | 13.4 | 0.42 | 0.54 | 0.68 | 0.60 |
| 21 | Energy goods and services | 33.8 | 43.6 | 53.6 | −13.1 | 0.80 | 1.07 | 1.37 | −0.43 |
| 22 | Excluding food and energy | 6.0 | 7.0 | 6.9 | 5.0 | 5.59 | 6.51 | 6.41 | 4.56 |
| Personal consumption expenditures: | |||||||||
| 23 | Food and beverages purchased for off-premises consumption | 8.7 | 11.4 | 15.3 | 13.0 | … | … | … | … |
| 24 | Energy goods and services | 33.9 | 43.4 | 52.7 | −13.2 | … | … | … | … |
| 25 | Excluding food and energy | 4.8 | 5.6 | 4.7 | 4.6 | … | … | … | … |
| 26 | Gross domestic product | 6.8 | 8.3 | 9.0 | 4.3 | … | … | … | … |
| 27 | Exports of goods and services | 6.2 | 17.3 | 20.0 | −10.0 | … | … | … | … |
| 28 | Imports of goods and services | 6.3 | 13.5 | 13.2 | −4.0 | … | … | … | … |
- The estimated prices for gross domestic purchases under the contribution columns are also percent changes.
Measured in current dollars, personal income increased $291.3 billion in the third quarter, compared to an increase of $258.4 billion in the second quarter (table 3). The increase in personal income primarily reflected increases in compensation (led by increases in both private and government wages and salaries) and personal income receipts on assets.
Personal current taxes increased $55.5 billion in the third quarter after increasing $43.0 billion in the second quarter.
Disposable personal income (DPI) increased $235.8 billion, or 5.2 percent, in the third quarter after increasing $215.4 billion, or 4.8 percent, in the second quarter. Personal outlays increased $306.3 billion after increasing $409.2 billion in the second quarter.
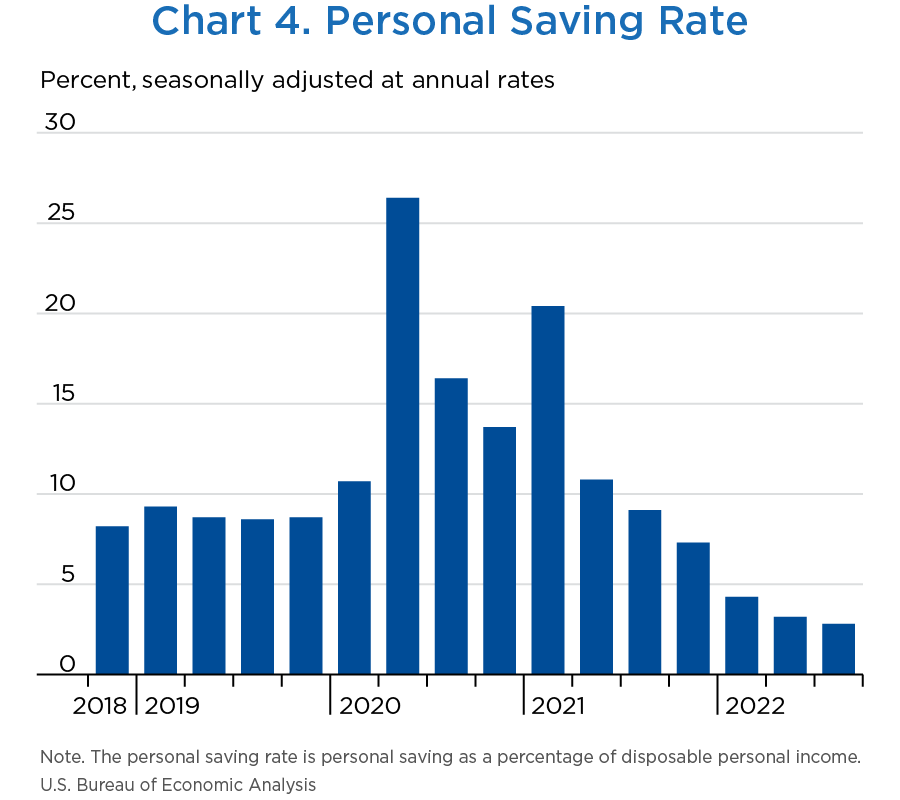
The personal saving rate (chart 4)—personal saving as a percentage of DPI—was 2.8 percent in the third quarter, compared with 3.2 percent in the second quarter.
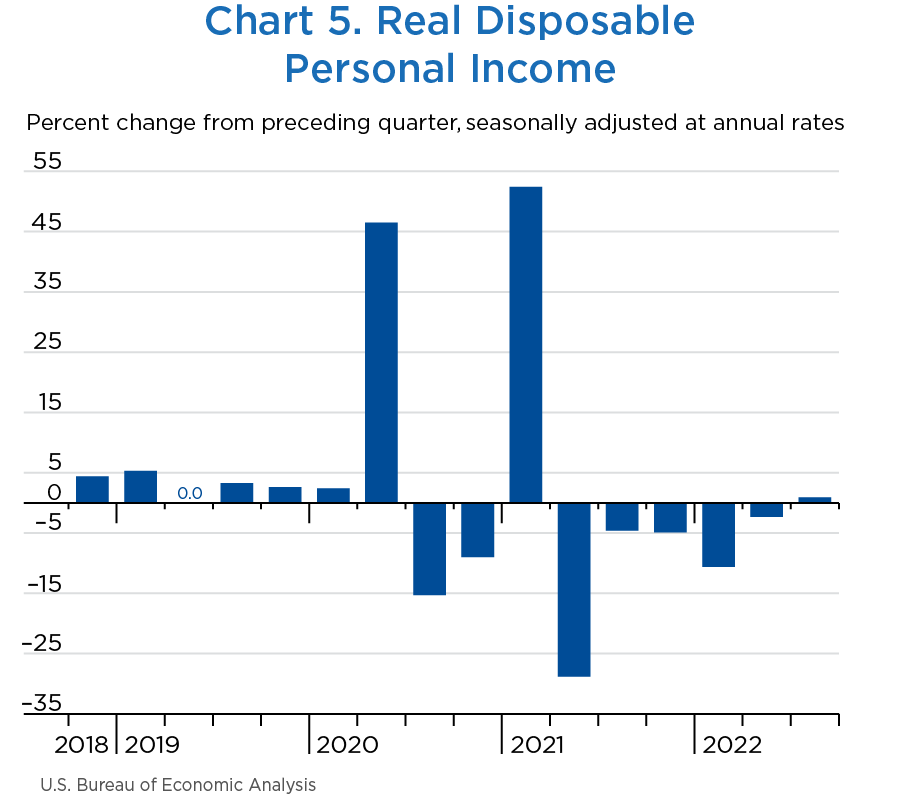
Real DPI (chart 5) increased 0.9 percent in the third quarter after decreasing 2.3 percent in the second quarter.
[Click chart to expand]
[Click chart to expand]
| Line | Series | Level | Change from preceding period | ||||
|---|---|---|---|---|---|---|---|
| 2022 | 2021 | 2022 | |||||
| Q2 | Q3 | Q4 | Q1 | Q2 | Q3 | ||
| 1 | Personal income | 21,578.3 | 21,869.6 | 156.9 | 157.7 | 258.4 | 291.3 |
| 2 | Compensation of employees | 13,415.2 | 13,632.7 | 363.1 | 215.4 | 155.5 | 217.5 |
| 3 | Wages and salaries | 11,058.0 | 11,245.9 | 326.1 | 177.1 | 132.5 | 187.9 |
| 4 | Private industries | 9,457.7 | 9,622.8 | 317.5 | 162.1 | 119.9 | 165.1 |
| 5 | Goods-producing industries | 1,732.8 | 1,760.5 | 56.7 | 39.9 | 27.4 | 27.7 |
| 6 | Manufacturing | 1,027.9 | 1,041.9 | 34.4 | 19.9 | 14.7 | 14.0 |
| 7 | Services-producing industries | 7,724.9 | 7,862.4 | 260.8 | 122.2 | 92.5 | 137.5 |
| 8 | Trade, transportation, and utilities | 1,701.0 | 1,713.2 | 54.8 | 29.0 | 3.9 | 12.3 |
| 9 | Other services-producing industries | 6,023.9 | 6,149.2 | 206.1 | 93.2 | 88.6 | 125.2 |
| 10 | Government | 1,600.4 | 1,623.1 | 8.6 | 15.0 | 12.6 | 22.7 |
| 11 | Supplements to wages and salaries | 2,357.1 | 2,386.8 | 37.0 | 38.3 | 22.9 | 29.7 |
| 12 | Proprietors' income with IVA and CCAdj | 1,835.4 | 1,859.0 | −2.9 | 21.7 | 23.9 | 23.7 |
| 13 | Farm | 95.7 | 93.0 | −19.9 | 30.5 | 21.3 | −2.7 |
| 14 | Nonfarm | 1,739.7 | 1,766.1 | 17.0 | −8.9 | 2.7 | 26.4 |
| 15 | Rental income of persons with CCAdj | 775.9 | 794.9 | 16.9 | 5.3 | 31.0 | 19.0 |
| 16 | Personal income receipts on assets | 3,323.0 | 3,366.9 | 35.5 | 11.4 | 53.2 | 43.9 |
| 17 | Personal interest income | 1,708.6 | 1,743.4 | 1.8 | 13.3 | 37.8 | 34.8 |
| 18 | Personal dividend income | 1,614.4 | 1,623.6 | 33.7 | −1.9 | 15.4 | 9.1 |
| 19 | Personal current transfer receipts | 3,883.2 | 3,898.0 | −213.9 | −57.0 | 14.5 | 14.8 |
| 20 | Government social benefits to persons | 3,809.1 | 3,828.2 | −211.8 | −54.9 | 11.5 | 19.1 |
| 21 | Social security | 1,206.9 | 1,214.4 | 9.7 | 72.2 | 8.2 | 7.5 |
| 22 | Medicare | 911.8 | 920.3 | 10.4 | 8.0 | 3.8 | 8.5 |
| 23 | Medicaid | 789.5 | 790.0 | −3.2 | 18.1 | 26.4 | 0.5 |
| 24 | Unemployment insurance | 18.6 | 18.5 | −211.4 | −10.2 | −5.0 | −0.1 |
| 25 | Veterans' benefits | 159.7 | 161.7 | 1.3 | 1.3 | 2.1 | 2.0 |
| 26 | Other | 722.7 | 723.2 | −18.8 | −144.3 | −23.9 | 0.6 |
| 27 | Other current transfer receipts, from business (net) | 74.1 | 69.8 | −2.0 | −2.1 | 3.0 | −4.2 |
| 28 | Less: Contributions for government social insurance | 1,654.4 | 1,682.0 | 41.8 | 38.9 | 19.7 | 27.6 |
| 29 | Less: Personal current taxes | 3,188.5 | 3,244.0 | 112.8 | 339.4 | 43.0 | 55.5 |
| 30 | Equals: Disposable personal income (DPI) | 18,389.8 | 18,625.6 | 44.0 | −181.7 | 215.4 | 235.8 |
| 31 | Less: Personal outlays | 17,798.7 | 18,105.0 | 376.0 | 370.5 | 409.2 | 306.3 |
| 32 | Personal consumption expenditures | 17,261.3 | 17,517.1 | 370.7 | 356.8 | 386.6 | 255.8 |
| 33 | Personal interest payments1 | 313.1 | 363.0 | 1.6 | 10.7 | 19.6 | 49.9 |
| 34 | Personal current transfer payments | 224.2 | 224.8 | 3.7 | 3.0 | 3.0 | 0.6 |
| 35 | Equals: Personal saving | 591.1 | 520.6 | −332.0 | −552.2 | −193.8 | −70.5 |
| 36 | Personal saving as a percentage of DPI | 3.2 | 2.8 | … | … | … | … |
| Addenda: | |||||||
| Percent change at annual rate | |||||||
| 37 | Current-dollar DPI | … | … | 1.0 | −3.9 | 4.8 | 5.2 |
| 38 | Real DPI, chained (2012) dollars | … | … | −4.9 | −10.6 | −2.3 | 0.9 |
| The effects of selected federal pandemic response programs on personal income (billions of dollars) | |||||||
| In farm proprietors' income with IVA and CCAdj: | |||||||
| 39 | Coronovirus Food Assistance Program2 | 0.0 | 0.0 | −7.4 | −0.6 | −0.6 | 0.0 |
| 40 | Paycheck Protecton Program loans to businesses3 | 0.0 | 0.0 | −6.5 | −0.7 | 0.0 | 0.0 |
| In nonfarm proprietors' income with IVA and CCAdj: | |||||||
| 41 | Paycheck Protecton Program loans to businesses3 | 0.0 | 0.0 | −134.1 | −22.8 | 0.0 | 0.0 |
| In government social benefits to persons, Medicare: | |||||||
| 42 | Increase in Medicare rembursement rates4 | 7.9 | 0.0 | 0.2 | 0.1 | −7.9 | −7.9 |
| In government social benefits to persons, Unemployment insurance5: | |||||||
| 43 | Extended Unemployment Benefits | 0.1 | 0.0 | −1.2 | −0.4 | −0.1 | 0.0 |
| 44 | Pandemic Emergency Unemployment Compensation | 0.5 | 0.3 | −48.9 | −2.0 | −0.3 | −0.2 |
| 45 | Pandemic Unemployment Assistance | 0.4 | 0.2 | −41.4 | −1.3 | −0.4 | −0.2 |
| 46 | Pandemic Unemployment Compensation Payments | 0.0 | 0.0 | −110.5 | 0.0 | 0.0 | 0.0 |
| In government social benefits to persons, other: | |||||||
| 47 | Child tax credit6 | 94.3 | 94.3 | 4.2 | −129.7 | 0.0 | 0.0 |
| 48 | Economic impact payments7 | 0.0 | 0.0 | −24.7 | −14.2 | 0.0 | 0.0 |
| 49 | Lost wages supplemental payments8 | 0.0 | 0.0 | −0.1 | 0.0 | 0.0 | 0.0 |
| 50 | Paycheck Protecton Program loans to NPISH3 | 0.0 | 0.0 | −17.2 | −1.6 | 0.0 | 0.0 |
| 51 | Provider Relief Fund to NPISH9 | 20.0 | 8.1 | 13.5 | −5.4 | −6.9 | −11.9 |
| In personal outlays, personal interest payments: | |||||||
| 52 | Student loan forbearance10 | −37.8 | −37.8 | 0.0 | 0.0 | 0.0 | 0.0 |
- CCAdj
- Capital consumption adjustment
- IVA
- Inventory valuation adjustment
- NPISH
- Nonprofit institutions serving households
- Consists of nonmortgage interest paid by households. Note that mortgage interest paid by households is an expense item in the calculation of rental income of persons.
- The Coronavirus Food Assistance Program, initially established by the Coronavirus Aid, Relief and Economic Security Act (CARES), provides direct support to farmers and ranchers where prices and market supply chains have been impacted by the COVID–19 pandemic.
- The Paycheck Protection Program, initially established by the CARES Act, provides forgivable loans to help small businesses and nonprofit institutions make payroll and cover other expenses. It also provides funding to reimburse private lending institutions for the costs of administering these loans. For more information, see “How does the Paycheck Protection Program impact the national income and product accounts (NIPAs)?”.
- A 2 percent reduction in reimbursements paid to Medicare service providers that went into effect in 2013 was initially suspended by the CARES Act. The resulting increased reimbursement rates went into effect beginning on May 1, 2020.
- Unemployment insurance benefits were expanded through several programs that were initially established through the CARES Act. For more information, see “How will the expansion of unemployment benefits in response to the COVID–19 pandemic be recorded in the NIPAs?”.
- The American Rescue Plan increased the Child Tax Credit to $3,000 per child over the age of six and $3,600 for children under the age of six, and raised the age limit from 16 to 17. It also authorized that up to half of these credits could be distributed through advance payments during the tax year, while the rest would be claimed when parents file tax returns the following year.
- Economic impact payments, initially established by the CARES Act, provide direct payments to individuals. For more information, see “How are the federal economic impact payments to support individuals during the COVID–19 pandemic recorded in the NIPAs?”
- The Federal Emergency Mangement Agency (FEMA) was authorized to make payments from the Disaster Relief Fund to supplement wages lost as a result of the COVID–19 pandemic.
- The Department of Health and Human Services distributes money from the Provider Relief Fund to hospitals and health care providers on the front lines of the coronavirus response. This funding supports health care-related expenses or lost revenue attributable to COVID–19 and ensures uninsured Americans can get treatment for COVID–19. In the NIPAs, funds provided to nonprofit hospitals are recorded as social benefits.
- Interest payments due on certain categories of federally-held student loans were initially suspended by the CARES Act. For more information, see “How does the federal response to the COVID–19 affect BEA's estimate of personal interest payments”.
The increase in third-quarter real GDP was revised up 0.3 percentage point from the advance estimate, primarily reflecting upward revisions to consumer spending, nonresidential fixed investment, state and local government spending, and exports that were partly offset by downward revisions to private inventory investment. Imports were revised down (table 4).
- Within consumer spending, an upward revision to goods was partly offset by a downward revision to services, based primarily on revised U.S. Census Bureau (Census) Monthly Retail Trade Survey (MRTS) data.
- Within goods, recreational goods and vehicles, food and beverages, clothing and footwear, as well as “other” nondurable goods were leading contributors. Gasoline and other energy goods was also revised up, based on new U.S. Energy Information Administration (EIA) data.
- Within services, the leading contributor to the downward revision was housing and utilities (notably, natural gas), based on EIA data. Food services and accommodations (led by food services) was revised up, based on revised MRTS data.
- Within nonresidential fixed investment, the revised estimates reflected an upward revision to structures that was partly offset by a downward revision to intellectual property products.
- For structures, the upward revision was led by manufacturing structures, based primarily on new September and revised July and August Census Value of Construction Put in Place (VPIP) data.
- Within intellectual property products, a downward revision to research and development (R&D), based primarily on new third-quarter R&D expense data from financial statements of publicly traded companies, was partly offset by an upward revision to software, based primarily on new Census Quarterly Services Survey data.
- The upward revision to state and local government spending primarily reflected an upward revision to structures investment (notably, highway and street construction), based on Census VPIP data.
- For both exports and imports, the revised estimates primarily reflected updated data from BEA's International Transactions Accounts as well as new and revised Census trade in goods data for September.
- Within exports, both goods (led by nonpetroleum industrial supplies and materials) and services (led by travel) were revised up.
- Within imports, both goods (led by computers, peripherals, and parts as well as durable industrial supplies and materials) and services (led by transport) were revised down.
- The revision to private inventory investment was led by downward revisions to “other” industries (notably, information) and wholesale trade, based primarily on new and updated Census inventory data.
| Line | Series | Change from preceding period (percent) | Contribution to percent change in real GDP (percentage points) | ||||
|---|---|---|---|---|---|---|---|
| Advance estimate | Second estimate | Second estimate minus advance estimate | Advance estimate | Second estimate | Second estimate minus advance estimate | ||
| 1 | Gross domestic product (GDP)1 | 2.6 | 2.9 | 0.3 | 2.6 | 2.9 | 0.3 |
| 2 | Personal consumption expenditures | 1.4 | 1.7 | 0.3 | 0.97 | 1.18 | 0.21 |
| 3 | Goods | −1.2 | −0.2 | 1.0 | −0.28 | −0.04 | 0.24 |
| 4 | Durable goods | −0.8 | −0.3 | 0.5 | −0.07 | −0.03 | 0.04 |
| 5 | Nondurable goods | −1.4 | −0.1 | 1.3 | −0.20 | −0.01 | 0.19 |
| 6 | Services | 2.8 | 2.7 | −0.1 | 1.24 | 1.22 | −0.02 |
| 7 | Gross private domestic investment | −8.5 | −9.1 | −0.6 | −1.59 | −1.71 | −0.12 |
| 8 | Fixed investment | −4.9 | −4.1 | 0.8 | −0.89 | −0.74 | 0.15 |
| 9 | Nonresidential | 3.7 | 5.1 | 1.4 | 0.49 | 0.66 | 0.17 |
| 10 | Structures | −15.3 | −6.9 | 8.4 | −0.41 | −0.18 | 0.23 |
| 11 | Equipment | 10.8 | 10.7 | −0.1 | 0.54 | 0.53 | −0.01 |
| 12 | Intellectual property products | 6.9 | 5.8 | −1.1 | 0.36 | 0.31 | −0.05 |
| 13 | Residential | −26.4 | −26.8 | −0.4 | −1.37 | −1.40 | −0.03 |
| 14 | Change in private inventories | --- | --- | ...... | −0.70 | −0.97 | −0.27 |
| 15 | Net exports of goods and services | --- | --- | --- | 2.77 | 2.93 | 0.16 |
| 16 | Exports | 14.4 | 15.3 | 0.9 | 1.63 | 1.72 | 0.09 |
| 17 | Goods | 17.2 | 17.7 | 0.5 | 1.34 | 1.38 | 0.04 |
| 18 | Services | 8.3 | 9.9 | 1.6 | 0.29 | 0.34 | 0.05 |
| 19 | Imports | −6.9 | −7.3 | −0.4 | 1.14 | 1.21 | 0.07 |
| 20 | Goods | −8.7 | −9.1 | −0.4 | 1.20 | 1.25 | 0.05 |
| 21 | Services | 2.3 | 1.5 | −0.8 | −0.06 | −0.04 | 0.02 |
| 22 | Government consumption expenditures and gross investment | 2.4 | 3.0 | 0.6 | 0.42 | 0.53 | 0.11 |
| 23 | Federal | 3.7 | 3.4 | −0.3 | 0.23 | 0.22 | −0.01 |
| 24 | National defense | 4.7 | 4.4 | −0.3 | 0.17 | 0.16 | −0.01 |
| 25 | Nondefense | 2.3 | 2.1 | −0.2 | 0.06 | 0.06 | 0.00 |
| 26 | State and local | 1.7 | 2.8 | 1.1 | 0.19 | 0.31 | 0.12 |
| Addenda: | |||||||
| 27 | Final sales of domestic product | 3.3 | 4.0 | 0.7 | ...... | ...... | ...... |
| 28 | Gross domestic purchases price index | 4.6 | 4.7 | 0.1 | ...... | ...... | ...... |
| 29 | GDP price index | 4.1 | 4.3 | 0.2 | ...... | ...... | ...... |
- The GDP estimates under the contribution columns are also percent changes.
Measured in current dollars, profits from current production (corporate profits with the inventory valuation adjustment and the capital consumption adjustment) decreased $31.6 billion, or 1.1 percent at a quarterly rate, in the third quarter after increasing $131.6 billion in the second quarter (table 5). Profits of domestic financial corporations decreased $32.9 billion, profits of domestic nonfinancial corporations increased $6.1 billion, and rest-of-the-world profits decreased $4.7 billion.
| Line | Series | Billions of dollars (annual rate) | Percent change from preceding quarter (quarterly rate) | |||||||
|---|---|---|---|---|---|---|---|---|---|---|
| Level | Change from preceding quarter | |||||||||
| 2022 | 2021 | 2022 | 2021 | 2022 | ||||||
| Q3 | Q4 | Q1 | Q2 | Q3 | Q4 | Q1 | Q2 | Q3 | ||
| Current production measures: | ||||||||||
| 1 | Corporate profits with IVA and CCAdj | 2,969.7 | 22.4 | 3.7 | 131.6 | −31.6 | 0.8 | 0.1 | 4.6 | −1.1 |
| 2 | Domestic industries | 2,512.1 | 11.4 | −10.4 | 106.2 | −26.9 | 0.5 | −0.4 | 4.4 | −1.1 |
| 3 | Financial | 431.4 | 1.6 | −26.8 | −46.0 | −32.9 | 0.3 | −5.0 | −9.0 | −7.1 |
| 4 | Nonfinancial | 2,080.6 | 9.8 | 16.4 | 152.2 | 6.1 | 0.5 | 0.9 | 7.9 | 0.3 |
| 5 | Rest of the world | 457.6 | 11.0 | 14.2 | 25.5 | −4.7 | 2.7 | 3.3 | 5.8 | −1.0 |
| 6 | Receipts from the rest of the world | 971.2 | 7.8 | 17.1 | 56.1 | 3.1 | 0.9 | 1.9 | 6.2 | 0.3 |
| 7 | Less: Payments to the rest of the world | 513.6 | −3.2 | 2.9 | 30.6 | 7.8 | −0.7 | 0.6 | 6.4 | 1.5 |
| 9 | Less: Taxes on corporate income | 452.3 | 42.9 | 65.1 | −16.4 | −26.3 | 11.1 | 15.1 | −3.3 | −5.5 |
| 10 | Equals: Profits after tax | 2,517.4 | −20.5 | −61.4 | 148.0 | −5.2 | −0.8 | −2.5 | 6.2 | −0.2 |
| 11 | Net dividends | 1,687.0 | 36.4 | 13.4 | −3.1 | −53.4 | 2.1 | 0.8 | −0.2 | −3.1 |
| 12 | Undistributed profits from current production | 830.3 | −56.9 | −74.8 | 151.2 | 48.2 | −7.5 | −10.6 | 24.0 | 6.2 |
| 13 | Net cash flow with IVA | 3,106.5 | 54.9 | −14.6 | 116.4 | 152.5 | 2.0 | −0.5 | 4.1 | 5.2 |
- CCAdj
- Capital consumption adjustment
- IVA
- Inventory valuation adjustment
Footnotes
- “Real” estimates are in chained (2012) dollars, and price indexes are chain-type measures. Each GDP estimate for a quarter (advance, second, and third) incorporates increasingly comprehensive and improved source data; for more information, see “The Revisions to GDP, GDI, and Their Major Components” in the January 2021 Survey of Current Business. Quarterly estimates are expressed at seasonally adjusted annual rates, which reflect a rate of activity for a quarter as if it were maintained for a year.
- In this article, “consumer spending” refers to “personal consumption expenditures,” “inventory investment” refers to “change in private inventories,” and “government spending” refers to “government consumption expenditures and gross investment.”