

BEA's Economic Accounts, Part 3
The Numbers Behind the Nation
The U.S. Bureau of Economic Analysis (BEA) National Economic Accounts (NEAs) give a coherent, economy-wide picture of what is being produced, what income is being generated, and how that income is used or saved. The accounts organize the U.S. economy into a consistent framework rather than a collection of disconnected statistics. Through this framework, the national accounts provide core economic measures that are timely enough to guide decisions and rigorous enough to support analysis.
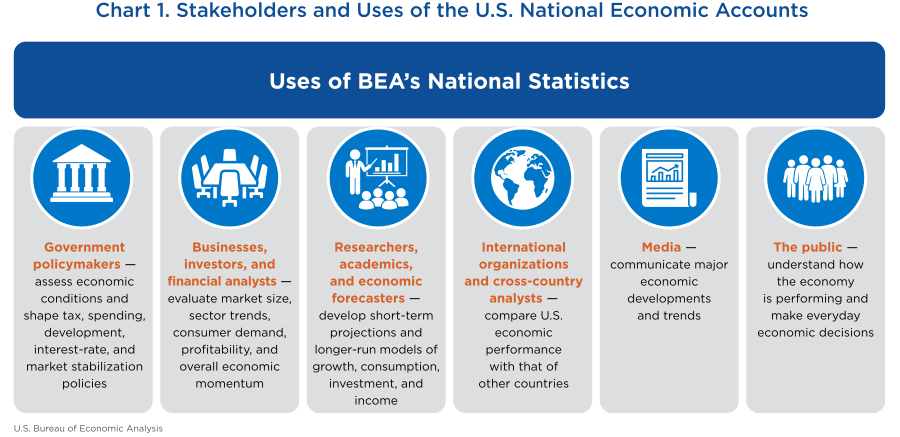
BEA's national statistics are widely used to analyze the economy, guide policy, and support economic development and planning (chart 1).
The NEAs are guided by three core principles: comprehensiveness, integration, and consistency. These principles ensure the national accounts present a relevant, timely, and accurate picture of U.S. economic activity. This article provides a brief history behind their development and examines the NEAs through the lens of these guiding principles.
The U.S. national accounts were developed in the 1930s during the Great Depression when policymakers realized they lacked a comprehensive way to measure national economic activity. Simon Kuznets, working for the U.S. government, produced early national income estimates for 1929 to 1932, giving the country its first systematic picture of output and income.
In the late 1930s and early 1940s, the system expanded. Personal income estimates began to appear, and during World War II, broader measures of production and expenditure were developed to support wartime planning. By 1947, the United States had published a more complete double-entry national accounting framework, which became the foundation of the modern national accounts.
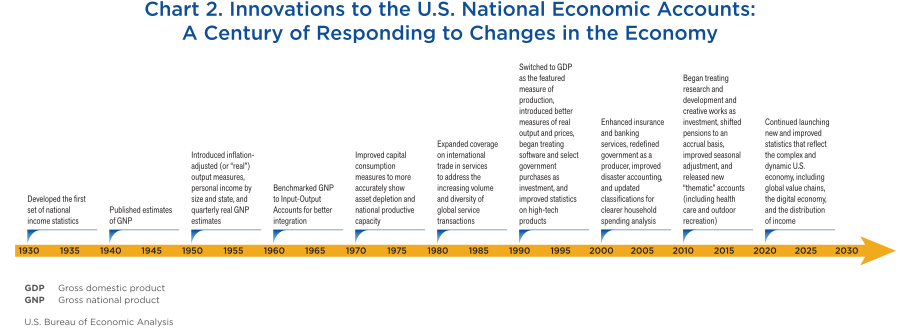
Since World War II, the accounts have been repeatedly expanded and refined to stay in sync with the evolving U.S. economy. Over the decades, BEA has introduced gross domestic product (GDP) as its headline measure, launched quarterly estimates and inflation-adjusted, or “real,” measures, improved the treatment of government activity and international transactions, and enhanced integration with the Input-Output and Industry Economic Accounts. Later updates reclassified some activities, such as spending on software, research and development, and entertainment and artistic originals, as investment.
Over the last decade, BEA has continued to keep pace with the economy, including the following improvements:
- Global value chains. In 2021, the Bureau released its first global value chain statistics to provide a better understanding of the mix of domestic and foreign products in supply chains. In 2026, the Bureau expanded these statistics to cover goods and services sold to U.S. consumers, businesses, and governments and those that become U.S. exports, and it released the Global Value Chain Analyzer to make it easier to access these data.
- Digital economy. BEA is creating new tools to track the impact of rapidly evolving technologies on the U.S. economy and global supply chains. A major focus of this effort is studying how artificial intelligence (AI) influences economic activity, including its contribution to growth, industry output, and workforce involvement.
- Distribution of personal income. In 2020, the Bureau launched data on the distribution of personal income, providing a new view of how households share economic growth. Since then, BEA expanded these statistics to include disposable personal income, consumer spending, prices, and state-level distributions; implemented cutting-edge methods to release data faster; and posted a new, interactive dashboard—the Income Distribution Analysis Tool.
- Thematic accounts. BEA launched “thematic” accounts (that is, specialized statistical frameworks highlighting economic activity related to a particular sector or topic). These include arts and cultural production, health care, outdoor recreation, the marine economy, and the digital economy. BEA is currently exploring a thematic account for AI production.
In summary, BEA's longstanding record of innovation supports its core mission to provide relevant, timely, and accurate data needed to understand the U.S. economy (chart 2).
The NEAs are built on the same foundational principles that guide all BEA's economic accounts: comprehensiveness, integration, and consistency. These principles ensure the national accounts provide a detailed, multidimensional view of the U.S. economy; are interconnected through standardized economic relationships, common estimation methods, shared data inputs, and synchronized releases and updates; and apply uniform definitions, accounting concepts, and statistical conventions.
Comprehensiveness
The NEAs present a comprehensive view of U.S. economic activity across three dimensions: the scope of the statistics (the “breadth”), the detail offered (the “depth”), and the time periods covered (the “length”).
Scope (breadth)
Broadly, the NEAs are a system of interrelated accounts that form a unified picture of the domestic economy. The structure of the accounts and the underlying economic concepts align closely with international standards as outlined in the U.N. Statistical Division's System of National Accounts and related manuals. This framework establishes the boundaries of the accounts, ensures internal consistency, and supports comparability with statistics from other countries. For more information, see the section “Consistency” below.
BEAs' national accounts comprise three sets of accounts: the National Income and Product Accounts (NIPAs), the Industry Economic Accounts, and the Fixed Assets Accounts (FAAs). As indicated previously, the national accounts also cover thematic accounts and supplemental statistics.
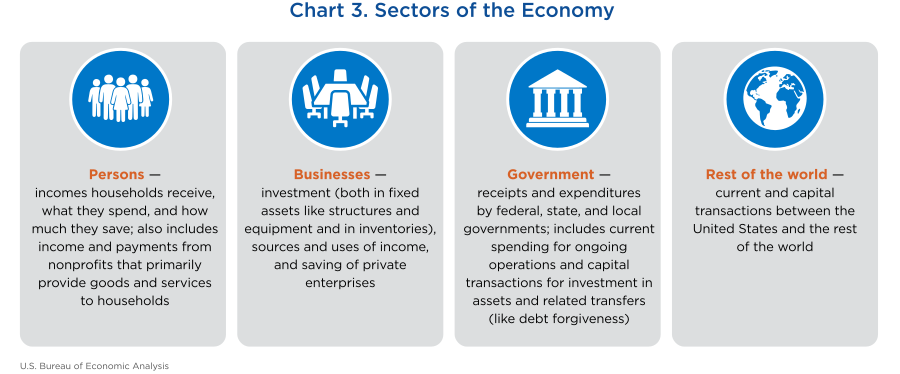
National Income and Product Accounts. The NIPAs feature statistics on economic production, income, spending, and saving. This includes aggregates for the whole economy (for example, GDP, gross domestic income (GDI), and gross saving) as well as information by sector. There are three main sectors—persons, businesses, and government; the rest of the world is also included to cover transactions between U.S. residents and foreign residents (chart 3). The NIPAs capture the contribution of each sector to the output of the economy, their income and outlays, and their saving and investment. BEA summarizes the scope of the NIPAs, including statistics related to each of these sectors, in a set of seven accounts.
While GDP is its marquee concept, the NIPAs present other measures of economic growth. This includes “national” statistics, or the value of the production or incomes earned by U.S. residents, regardless of whether the related activity happens in the United States or abroad. It also includes statistics like gross domestic purchases (which exclude net exports), final sales to domestic purchasers (which exclude net exports and inventory investment), and final sales to private domestic purchasers (which exclude net exports, inventory investment, and government spending).
Industry Economic Accounts. The industry accounts show how industries produce goods and services, use inputs, and contribute to GDP. This includes the GDP by Industry Accounts, which capture value added by industry, and the Input-Output Accounts, which trace the flow of goods and services from each industry to other industries and to final users in the economy and the income originating in each industry.
Fixed Assets Accounts. The FAAs measure investment in fixed assets, the resulting capital stock, and the depreciation of those assets over time. These accounts provide statistics on physical structures, capital equipment and software, and consumer durable goods held by businesses, governments, and others.
Thematic accounts and supplemental statistics. The NEAs also include thematic accounts and supplemental statistics that support deeper economic analyses. BEA produces several thematic accounts that show activity related to a particular sector or aspect of the economy, like health care or outdoor recreation. The NEAs also include supplemental statistics on topics like the distribution of personal income that capture how income is shared among U.S. households and global value chains that track U.S. exports and imports in complex global supply chains.
Detail (depth)
The national accounts encompass detailed statistics for their core components as well as price measures and inflation-adjusted statistics for select series.
Core components. The NEAs present thousands of detailed series that break down key spending, income, and industry components. For spending and income, this includes indepth information on economic activities of businesses, government, households, and the rest of the world. For example, the consumer spending statistics cover over 350 categories of goods and services, including detail on motor vehicles, food and beverages, gasoline, housing and utilities, health care, and accommodations, showing how households and the nonprofits that serve them allocate their spending and how that shifts over time. Similarly, the NEAs include government current receipts by sources of income: current taxes, contributions for government social insurance (for example, Social Security contributions), interest, dividends, current transfer receipts (for example, donations, fees, and fines), and the current surplus of government enterprises. The NEAs also provide breakouts for federal government defense and nondefense and state and local government. Finally, the most detailed industry statistics cover more than 400 industries and industry groupings.
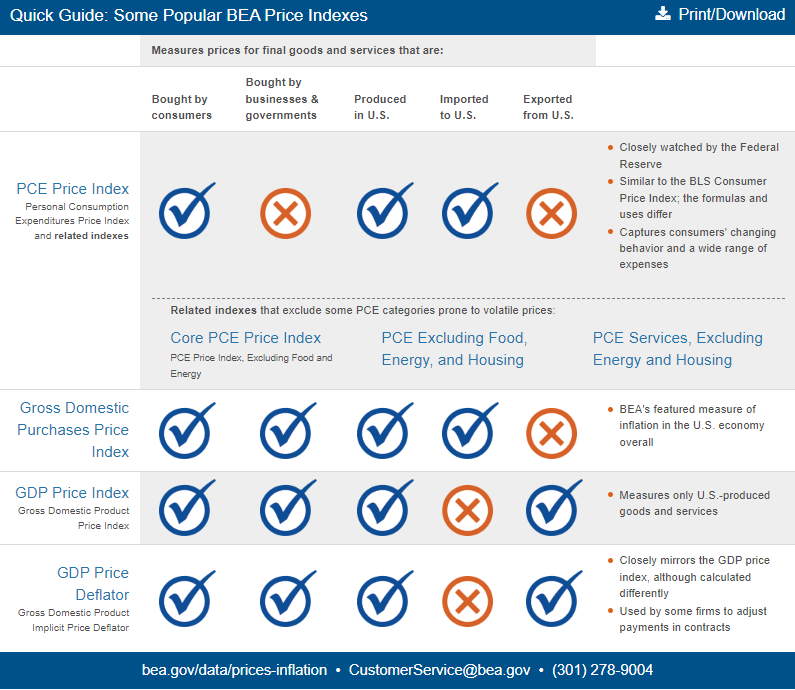
Price measures. The NEAs feature several price measures, representing the following different concepts:
- Gross domestic purchases price index. This is the featured price measure and reflects the prices of goods and services purchased by U.S. residents regardless of where they are produced. It includes imports and is impacted by changes in import prices.
- Gross domestic product price index. This measure reflects the prices of goods and services produced in the United States.
- Personal consumption expenditures (PCE) price index. The PCE price index captures the prices for consumer goods and services. It is often compared to the U.S. Bureau of Labor Statistics (BLS) Consumer Price Index.
The national accounts also include “less food and energy” variations for these indexes. The price index for PCE excluding food and energy (often referred to as “core” PCE prices) is watched closely by the Federal Reserve Board.
Nominal and inflation-adjusted statistics. The national accounts feature both nominal—or “current dollar”—and inflation-adjusted—or “real”—measures. Nominal measures value economic activity at current prices, while real measures remove the effects of price change, so they reflect changes in quantities or volume. Most inflation-adjusted series are calculated by deflating the nominal value by a related price index. In general, the NEAs provide real estimates for expenditure and industry series, especially GDP and most of its components, but not for most income series. For example, real GDI is calculated by deflating current-dollar GDI by the implicit price deflator for GDP. The national accounts do not, however, include inflation-adjusted statistics for the components of GDI.
Time periods (length)
The NEAs include annual, quarterly, and monthly statistics, along with long historical series that support analyses of both short-term and long-term economic trends. In general, national accounts data go back to 1929 for the earliest annual estimates, while many of the core quarterly NIPA series, including GDP, extend back to 1947. Monthly personal income and outlays statistics also go back to 1959. Finally, fully integrated industry statistics are available starting in 1997, with select historical data going back to 1947.
Integration
The NEAs are also integrated across three dimensions: with the International Economic Accounts (IEAs), with the Regional Economic Accounts (REAs), and within the NEAs themselves. This integration is essential for ensuring methodological coherence across all measures of economic activity, enabling users to directly link different perspectives of economic performance. Integration across and within BEA's accounts is accomplished through shared concepts, definitions, and classifications as well as the framework of national accounting. Integration with the IEAs and the REAs is covered in other articles in this series, so this section summarizes the main points for those aspects of integration and then focuses on internal integration for the national accounts, including how recent integration efforts have yielded more complete, accurate, and timely data across BEA's accounts.
Integration with the IEAs
The international accounts are closely integrated with the national accounts through shared definitions, classifications, and accounting principles. In several cases, statistics from the IEAs serve directly as source data for the NEAs. For example, exports and imports of goods and services from the U.S. International Transactions Accounts feed directly into the estimates of net exports used to calculate GDP based on the expenditures of final users. The industry accounts rely on the measures of international output at both the national and industry levels.
There are conceptual and methodological differences between the IEAs and the NEAs, including those related to the treatment of the U.S. territories and nonmonetary gold. For example, in the national accounts, transactions between the United States and its territories are included in the rest of the world; in the international accounts, they are treated as part of the United States. Exports and imports of precious metals in the NEAs also differ from those in the IEAs. Gold and silver can be used for two purposes: for industrial use (that is, as an input into the production of goods and services) and as investment (that is, as stores of wealth and hedges against inflation). The national accounts only capture the purchases of precious metals for industrial purposes. The IEAs include both types of transactions.
For more information on integration with the IEAs, see the related article in this series.
Integration with the REAs
Regional estimates are developed using methodologies that align with the NEAs. Wherever possible, the REAs also draw from the same source data. For some statistics, like housing services, wages and salaries, and farm income, BEA aggregates regional and national levels from detailed geographic data. For statistics that lack this rich geographic detail, analysts use alternative indicators to allocate national estimates across states and counties. Under either approach, the same conceptual framework is applied, and the regional accounts are benchmarked to the national accounts. Despite this integration, slight differences between the regional and national statistics may occur, primarily due to residency definitions. The REAs apply a narrower definition of residency that excludes economic activity that cannot be assigned to a specific state, resulting in minor differences between the regional and national totals. The forthcoming article on the REAs will provide more information on integration between BEA's national and regional accounts.
Integration within the NEAs
A third area of integration occurs within the NEAs themselves, where components are linked through standardized economic relationships, common estimation methods, shared data inputs, and synchronized releases and updates (chart 4).
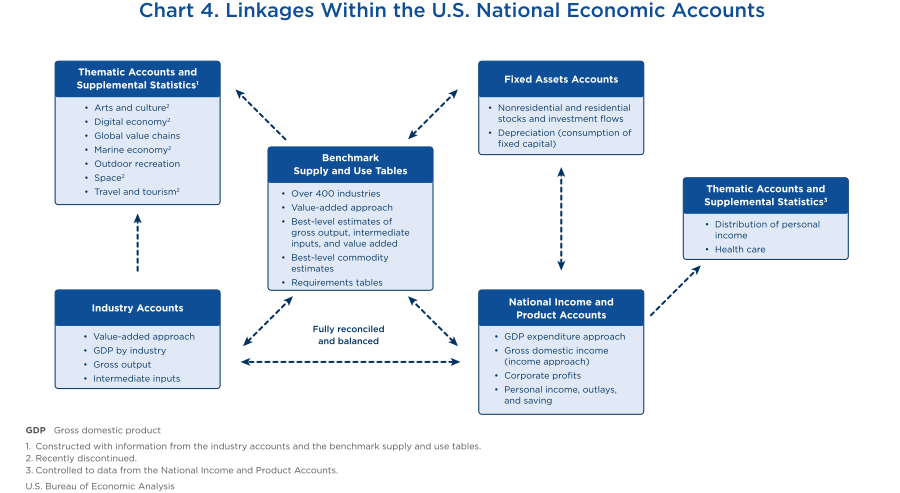
Standardized economic relationships. The benchmark supply and use tables are the core of the national accounts. For the industry accounts, these tables provide the “best-level” estimates of gross output, intermediate inputs, and value added. For the NIPAs, the value of GDP in the benchmark year is controlled to value added from the industry accounts. BEA ensures that these accounts are fully integrated by reconciling and balancing the NIPAs and the industry accounts to the benchmark tables and to each other. The Fixed Assets Accounts also link to the benchmark supply and use tables and to the NIPAs. For example, the estimates of depreciation in the NIPAs and in the FAAs are the same. The section “Common estimation methods” below provides more information on reconciliation and balancing.
Finally, thematic accounts and supplemental statistics rely on information from BEA's benchmark supply and use tables and the industry accounts to spotlight activities for various sectors or aspects of the economy, like outdoor recreation or global value chains. In other cases, supplemental statistics control directly to NIPA data. For example, the distribution of income statistics break out personal income and its components by quintiles.
The three approaches to measuring GDP provide a prime example of how the national accounts are integrated internally through economic relationships. Together, the NIPAs and the industry accounts capture three fundamental ways to measure the economy—by expenditure, income, and production (or value added) (chart 5).
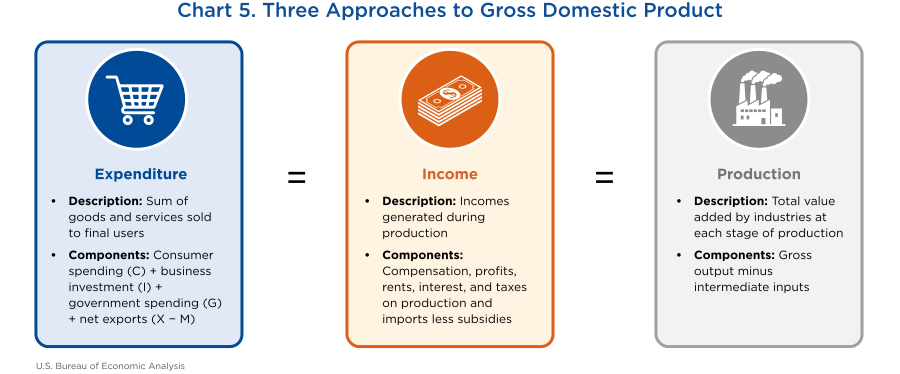
In principle, all three approaches should give identical values for GDP because they represent different ways of measuring the same underlying economic activity. In practice, GDP measured from the expenditure and income perspectives may differ due to differences in source data and estimating methods. The NIPAs include the resulting “statistical discrepancy” as a balancing item that reconciles the two approaches. As noted above, the expenditure and production approaches are controlled to one another to ensure they are equal.
Common estimation methods. The NIPAs, the industry accounts, and the FAAs share the same general estimation toolkit, including benchmarking, adjustment, extrapolation, commodity-flow analysis, margin and tax allocation, deflation, and reconciliation, but they apply these tools at different levels of detail and to different (yet consistent) accounting frameworks. Highlights of these methods include the following:
- Benchmarking to comprehensive source data. As noted above, all the accounts rely on Economic Census data and benchmark input-output relationships to establish the highest quality statistics.
- Interpolation and extrapolation from indicators. The accounts use timelier annual, quarterly, or monthly indicators to extend benchmark estimates forward and to fill gaps between benchmark periods. In addition, the accounts distinguish between “best level” (that is, comprehensive benchmark levels) and “best change” (that is, current-period movements built from timelier but less comprehensive data).
- Adjustments to source data. The accounts make conceptual, coverage, timing, and valuation adjustments so raw source data conform to national accounting definitions. For more information, see the section “Consistency” below.
- Commodity-flow methods. The NIPAs and the industry accounts use commodity-flow logic to trace domestic supply and allocate it across intermediate and final demand categories. In the NIPAs, this method is mainly used to estimate specific final demand components when direct purchaser data are incomplete (for example, for benchmark consumer spending statistics, for equipment investment, and for some government spending detail). In the industry accounts, the goal is not just to estimate one final demand category but to distribute each commodity across all intermediate and final uses.
- Margin and tax allocation methods. The NIPAs and the industry accounts estimate and apply transportation costs, wholesale margins, retail margins, and commodity taxes to move from producers' values to purchasers' values where needed. In the NIPAs, margins and taxes are mostly used to turn selected final demand estimates into purchaser value (specifically for series that rely on the commodity-flow method). In the industry accounts, margins and taxes are separated out and assigned across detailed transactions so the full input-output framework balances.
- Reconciliation and balancing. The accounts ensure economic relationships are internally consistent, most notably through reconciling and balancing the three approaches to GDP: expenditure, income, and production. Balancing the use table in the supply-use framework is a key example of this process. BEA typically bases initial estimates on previously published use tables and then updates them to align with gross output data from the GDP by Industry Accounts, as well as income and expenditure data from the NIPAs. Much of this updating is carried out by a balancing algorithm, which iteratively scales data in the use table to satisfy key accounting identities that link total industry and commodity output to total uses and value added. The FAAs also use a balancing routine for fixed investment by asset and by industry. In the NIPAs, balancing items are usually named residuals inside its integrated accounts. For example, as noted above, the statistical discrepancy ensures GDP and GDI are equal.
Shared data inputs. The accounts incorporate many of the same underlying data sources (table 1).
| U.S. Census Bureau | Other federal agencies | Other sources |
|---|---|---|
|
|
|
U.S. Bureau of Economic Analysis
Highlights of these shared data sources include the following:
- U.S. Census Bureau. The Economic Census is the most important common source, as it sets the benchmark levels for the Input-Output Accounts and is the highest quality input for many NIPA components. BEA also uses data from Census Bureau annual surveys and their higher-frequency monthly and quarterly complements as well as quarterly construction surveys and corporate financial reports.
- Other federal agencies. The NEAs incorporate a variety of data from many federal agencies other than the Census Bureau. For example, BLS publishes key source data on employment, earnings, prices, and related indicators. The Office of Management and Budget and the U.S. Department of the Treasury provide budget and federal transactions data. The U.S. Department of Agriculture releases critical information on farm production, inventories, and prices.
- Other sources. Beyond federal sources, the national accounts rely on data from trade associations, state government agencies, and special industry studies. For example, BEA motor vehicle statistics reflect data on auto and light truck unit production, sales, and inventories from Omdia (which includes the automative research and analysis division previously referred to as “Wards Intelligence”), and the registrations data used to break out vehicle sales between consumers and businesses are from Polk Automotive Solutions (previously “IHS Markit/Polk”).
Synchronized releases and updates. The availability of key source data is a major driver of when and how often BEA revises the NEAs. BEA updates the national accounts several times, as better information becomes available (chart 6).
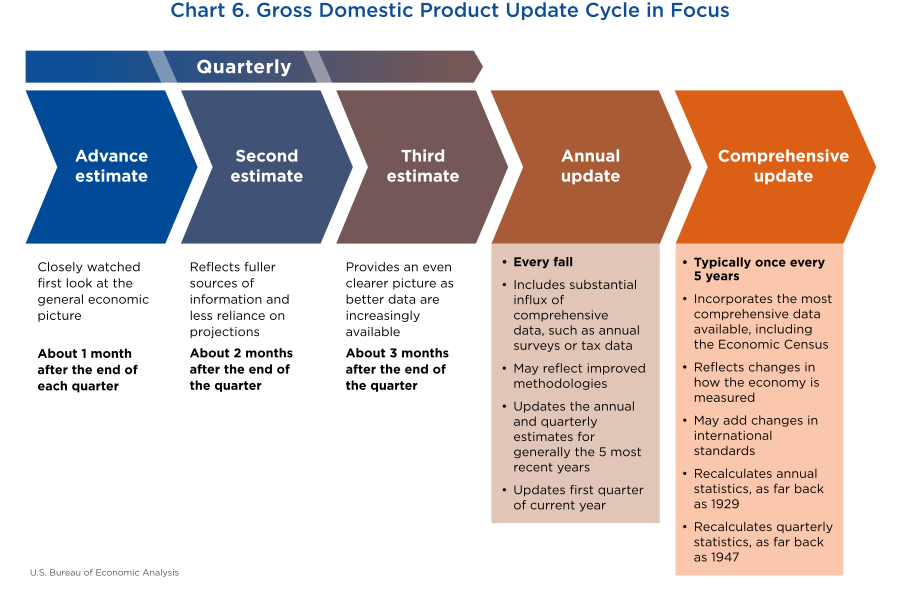
BEA has fully synchronized its releases of national and industry statistics through a multiyear optimization effort. Historically, national and industry accounts operated on different production schedules. The Bureau systematically re-engineered its organizational structure and internal processing to establish a unified system. This system relies on the same vintages of underlying source data and builds in feedback loops between macro national figures and sector-specific metrics, delivering improvements in both.
Every quarter, BEA releases the third estimate of national GDP concurrently with the quarterly breakdown of GDP by industry and gross output. In addition, the bulk of the annual and comprehensive benchmark statistics are now released close together rather than being spread over multiple months. For example, the 2026 annual updates of the national and industry accounts will launch on the same day (September 30, 2026).
Building on this effort, the Bureau also publishes many key state-level statistics, including state GDP and state personal income, at the same time as the national and industry data, providing users with a more complete, highly integrated, and timelier picture of the economy.
Consistency
The NEAs reflect a marriage of economic theory and accounting principles. To accomplish this, the national accounts apply uniform definitions, accounting concepts, and statistical conventions.
Definitions. As noted above, the System of National Accounts defines key economic concepts and sets the boundaries for the accounts. In many cases, BEA must adjust source data to align with these concepts and scope (table 2).
| Type | Purpose | Example |
|---|---|---|
| Concepts and definitions | Align source data with national account definitions | Tax data use historical cost and service lives, but the NIPAs and the FAAs require consumption of fixed capital based on current cost and economic service lives. |
| Coverage | Fill gaps where source data miss activity that belongs in the accounts | U.S. Census Bureau data on wholesale inventories do not include nonmerchant wholesalers, so BEA adds separate estimates for them. |
| Timing and valuation | Put transactions on the correct recording basis | BEA values goods at foreign port value, so Canadian import data reported at point of manufacture must be adjusted for inland transport to the export point. |
| Data inaccuracies or inconsistencies | Account for inaccurate or inconsistent source data that affect the accuracy and reliability of BEA's statistics | In the first quarter of 2025, BEA adjusted inventories to bring them to market value, consistent with an unprecedented increase in imported goods that was not consistently valued in Census inventory levels. |
- BEA
- U.S. Bureau of Economic Analysis
- FAAs
- Fixed Assets Accounts
- NIPAs
- National Income and Product Accounts
U.S. Bureau of Economic Analysis
Accounting concepts. BEA also adjusts data so they satisfy the accounting structure of the accounts, especially the identities linking output, income, expenditure, and saving and the recording of transactions. Key examples of these concepts include the following:
- Double-entry bookkeeping. The national accounts use principles of double-entry bookkeeping. In the NIPAs, each transaction is recorded as a payment by one sector and as a receipt by the same sector or by another sector. The seven-summary account denotes these counter-entries. In the industry accounts, the domestic supply of all commodities is either used as intermediate inputs by other industries or provided to final users.
- Accrual accounting. The NEAs use accrual-based accounting to ensure related receipts and payments are recorded in the same accounting period.
Statistical conventions. Standard accounting conventions in the NEAs include the following:
- Seasonal adjustment. Featured measures in the NEAs remove regular within-year patterns so underlying movements are easier to interpret.
- Annual rates. Most quarterly estimates are usually shown at annual rates, as if the change in the quarter is maintained for a full year.
- Real estimates. Real, or inflation-adjusted, statistics are shown in chained dollars. More specifically, BEA converts chain-type quantity indexes into dollar values using a reference year, currently 2017. So, chained dollars show how quantities change over time after removing price changes, while still expressing the result in something that looks like dollars.
The standard frameworks, common estimation methods, shared data sources, and synchronized release schedules noted above also support consistency across the accounts.
The National Economic Accounts provide a unified, comprehensive framework for understanding U.S. economic activity, offering measures that are both rigorous and timely. Built on the principles of comprehensiveness, integration, and consistency, the NEAs bring together production, income, and expenditure data in a way that allows policymakers, researchers, businesses, and the public to clearly assess economic performance. Their long historical span, detailed coverage across sectors and industries, and inclusion of both nominal and inflation-adjusted statistics make them essential for analyzing trends, evaluating policy impacts, and guiding economic decision making.
Decades of refinement have strengthened the accounts' ability to reflect an evolving economy. BEA's integration of national, regional, and international data—supported by shared methods, standardized definitions, and common data sources—ensures coherence across BEA's full suite of economic accounts. This interconnected structure allows users to link different economic perspectives, whether comparing domestic industries, tracing global transactions, or assessing household and business behavior. The NEAs also maintain consistency through established accounting conventions, careful adjustments to source data, and rigorous reconciliation methods that ensure internal balance.
Taken together, the NEAs serve as an indispensable statistical foundation for understanding the U.S. economy. Their development, ongoing innovation, and adherence to clear principles have made the accounts not only a reliable tool for monitoring economic performance but also a vital resource for long-term planning, research, and policy formulation.
Suggested citation
Alyssa Holdren, “BEA's Economic Accounts: The Numbers Behind the Nation,” Survey of Current Business (August 26, 2026), https://doi.org/10.66137/RGLF8547.
