

Charting the Economy
Second Quarter 2026
The U.S. Bureau of Economic Analysis (BEA) released its most recent estimate of gross domestic product (GDP) and other key statistics from the National Economic Accounts (NEAs), which include the National Income and Product Accounts (NIPAs) and the Industry Economic Accounts, and from the Regional Economic Accounts (REAs) on September 30, 2026.1 This quarter's “Charting the Economy” takes a closer look at the economy's performance in April, May, and June, with details on how much people are spending and earning, industry production and profits, and how prices are changing.
BEA also released results from the 2026 annual update of the NEAs. The update covered the first quarter of 2021 through the first quarter of 2026 and resulted in revisions to GDP, GDP by industry, gross domestic income (GDI), and their major components. The reference year remains 2017. An article describing the update in more detail was published in the Survey of Current Business in September. For the first time, BEA began to release the annual update of the REAs on the same day, including updates to GDP, personal income, and personal consumption expenditures by state. Updates to county GDP and personal income will be released on December 2, 2026, and an article with more details on the annual update of the REAs will be published in the Survey in December.
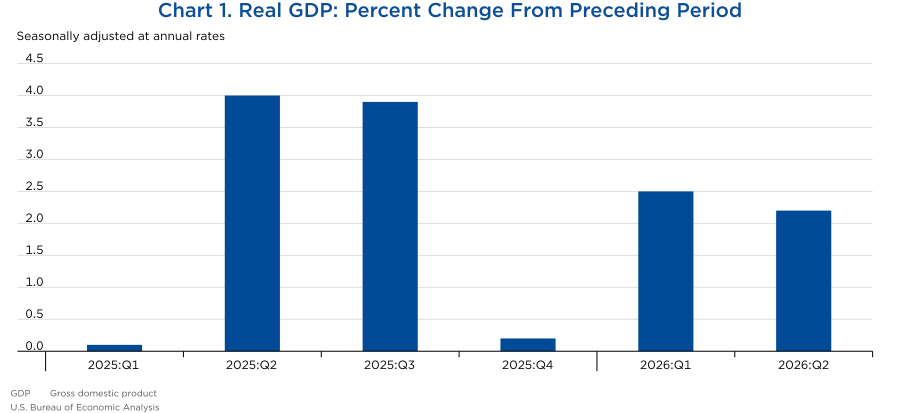
- In the second quarter, real GDP increased at an annual rate of 2.2 percent after increasing 2.5 percent (revised) in the first quarter.2
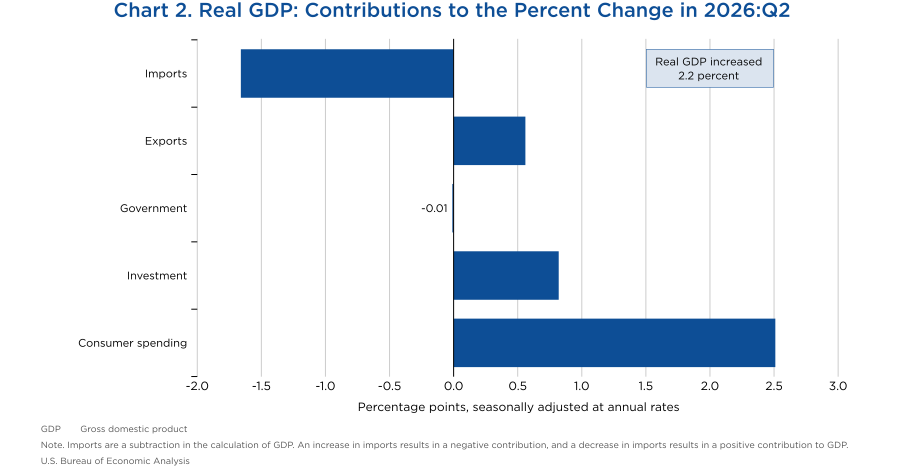
- The increase in real GDP in the second quarter reflected increases in consumer spending, investment, and exports that were partly offset by a decrease in government spending. Imports, which are subtracted in the calculation of GDP because they are embedded in other components of GDP, also increased.3
- The increase in consumer spending was driven by increases in both services and goods. The increase in services was led by health care (notably hospital and nursing home services) and recreation services (mainly admissions to specified spectator amusements). The increase in goods was led by “other nondurable goods” (notably pharmaceutical products) and motor vehicles and parts (mainly new light trucks).
- The increase in investment was led by increases in equipment (both industrial equipment and transportation equipment) and intellectual property products (mainly software) that were partly offset by a decrease in private inventories (led by “other industries”).
- The increase in exports reflected an increase in goods (led by petroleum and products) that were partly offset by a decrease in services (led by travel).
- The decrease in government spending reflected a decrease in nondefense consumption expenditures.
- The increase in imports primarily reflected an increase in goods (led by “other capital goods, except automotive”).
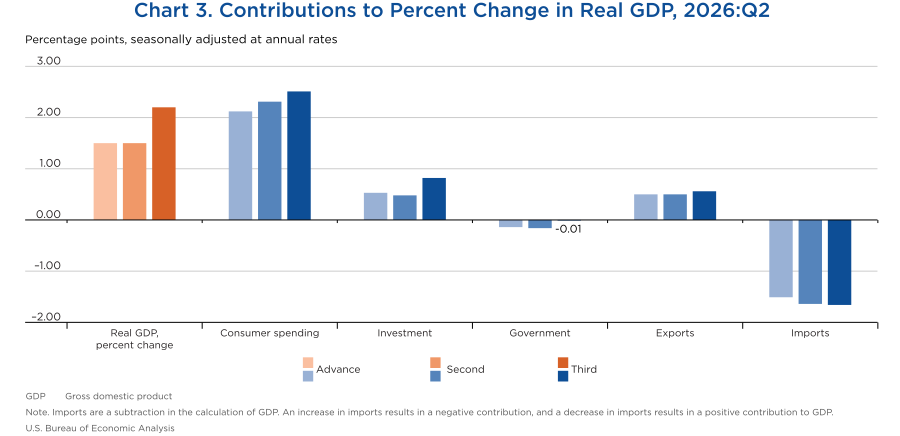
- In the third estimate for the second quarter, real GDP increased 2.2 percent, an upward revision of 0.7 percentage point from the second estimate, primarily reflecting upward revisions to investment, consumer spending, and government spending.
- In the second estimate, real GDP increased 1.5 percent, the same rate as in the advance estimate. An upward revision to consumer spending was partly offset by an upward revision to imports.
- In the advance estimate, real GDP increased at an annual rate of 1.5 percent.
- Each GDP estimate for a quarter incorporates increasingly comprehensive and improved source data. For more details, refer to “GDP Revision Information” on the BEA website.
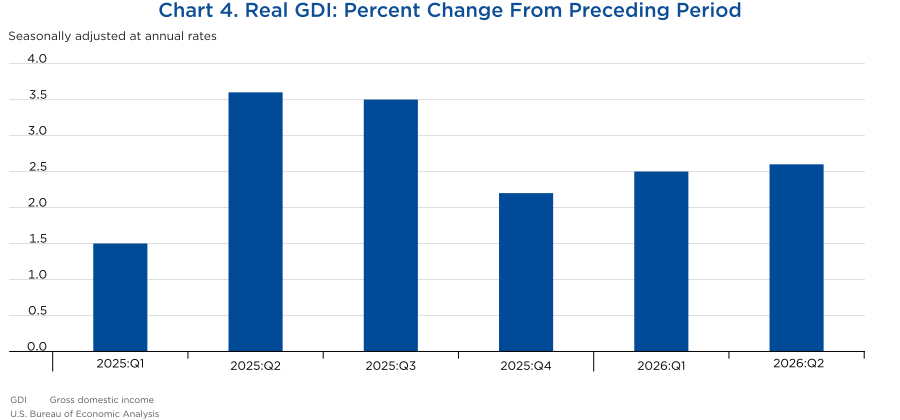
- Real GDI increased 2.6 percent at an annual rate in the second quarter, following an increase of 2.5 percent (revised) in the first quarter.
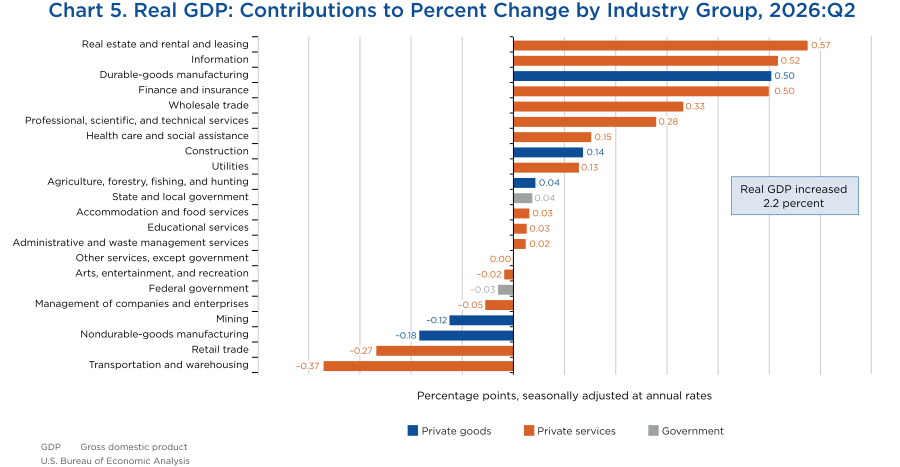
- From an industry perspective, the increase in real GDP in the second quarter reflected increases in real value added of 2.5 percent for private services-producing industries, 2.3 percent for private goods-producing industries, and less than 0.1 percent for government. The leading industry contributors to the increase in real GDP were real estate and rental and leasing, information, durable-goods manufacturing, and finance and insurance. The leading offsets were decreases in transportation and warehousing, retail trade, and nondurable-goods manufacturing.
- Overall, 14 of 22 industry groups contributed to the increase in real GDP in the second quarter.
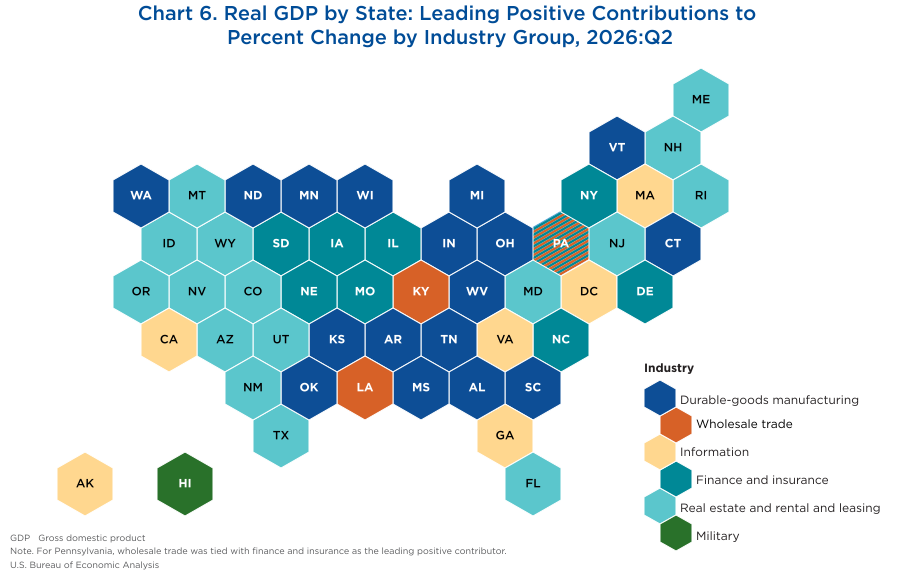
- From a regional perspective, real GDP grew in the second quarter for 44 states and the District of Columbia. The fastest growing states were New York and South Carolina. Growth in New York was led by finance and insurance industries, while growth in South Carolina was led by durable-goods manufacturing industries.
- Across the nation, finance and insurance was a leading positive contributor in 9 states, while durable-goods manufacturing was the leading positive contributor in 17 states.
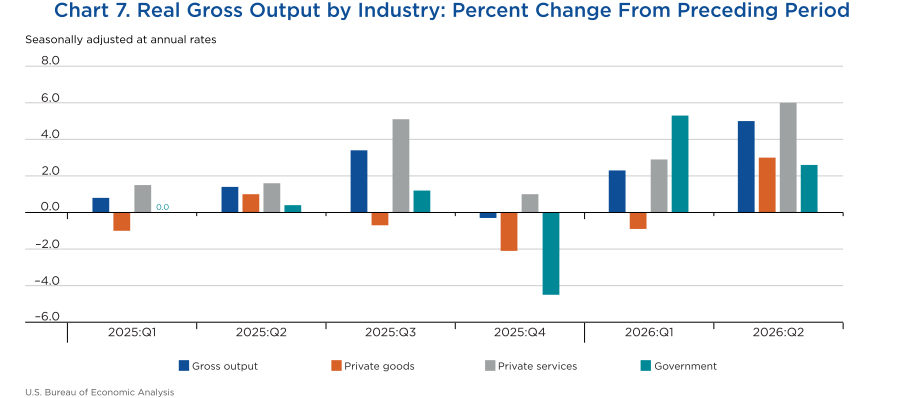
- Real gross output increased 5.0 percent in the second quarter, reflecting increases of 6.0 percent for private services-producing industries, 3.0 percent for private goods-producing industries, and 2.6 percent for government.
- Overall, 17 of 22 industry groups contributed to the increase in real gross output in the second quarter.4
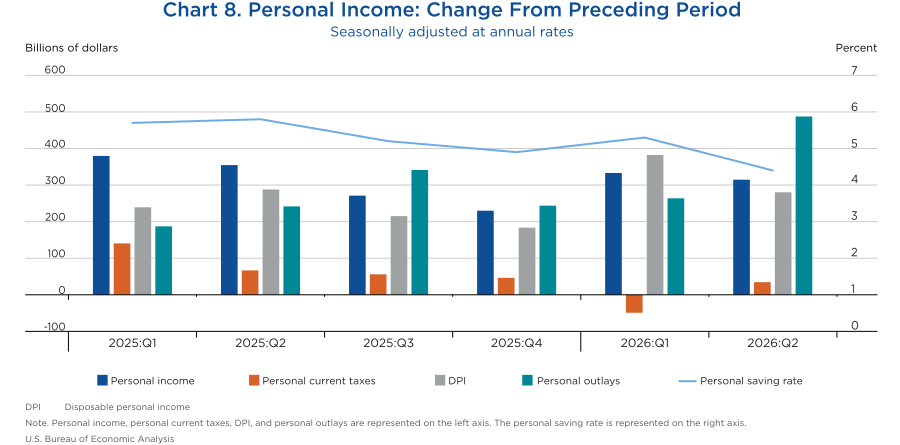
- Measured in current dollars, personal income increased $314.7 billion in the second quarter.
- Increases in compensation (led by private wages and salaries), personal current transfer receipts (mainly Medicare and Medicaid), and personal income receipts on assets (notably personal interest income) were the leading contributors.
- Personal current taxes increased $34.5 billion, disposable personal income increased $280.2 billion, and personal outlays increased $487.5 billion.
- The personal saving rate was 4.4 percent.
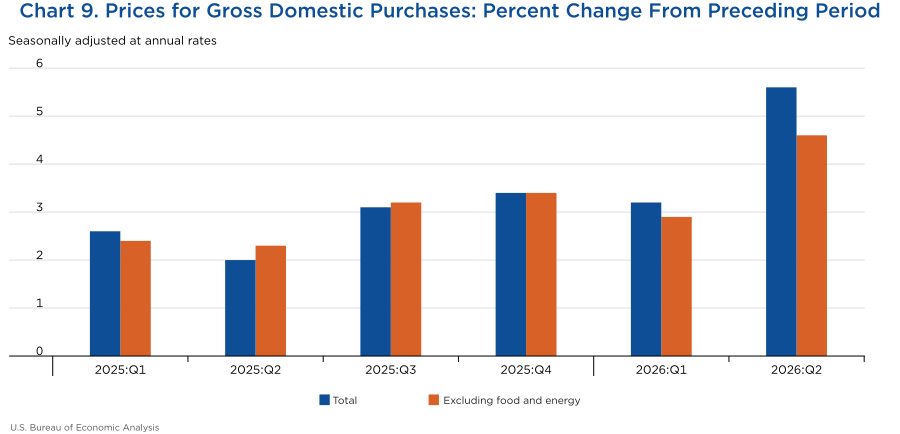
- The price index for gross domestic purchases increased 5.6 percent in the second quarter.
- Within gross domestic purchases, food prices increased 1.9 percent, and prices for energy goods and services increased 58.8 percent.
- Excluding food and energy, the price index for gross domestic purchases increased 4.6 percent.
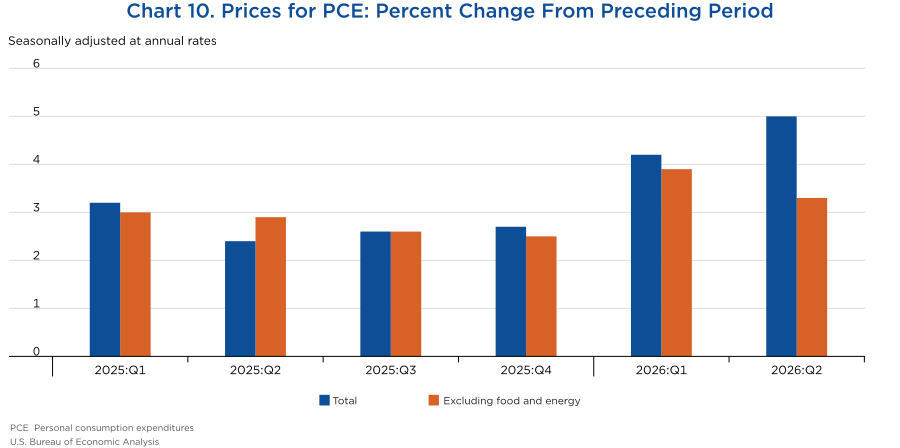
- The PCE price index increased 5.0 percent in the second quarter.
- Prices for goods increased 7.6 percent, led by gasoline and other energy goods and recreational goods and vehicles.
- Prices for services increased 3.9 percent, led by increases in housing and utilities, health care, and financial services and insurance.
- Excluding food and energy, the core PCE price index increased 3.3 percent.
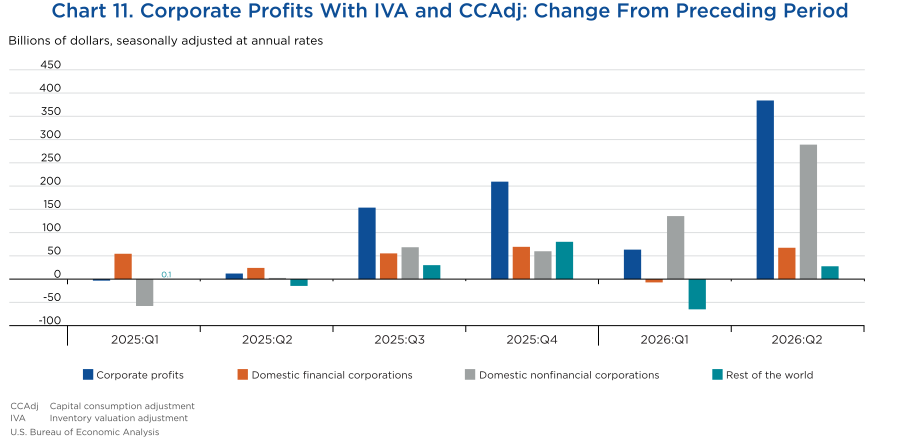
- Measured in current dollars, profits from current production (corporate profits with the inventory valuation adjustment (IVA) and the capital consumption adjustment) increased $384.0 billion in the second quarter.
- Profits of domestic financial corporations increased $67.4 billion, profits of domestic nonfinancial corporations increased $289.1 billion, and rest-of-the-world profits increased $27.6 billion.
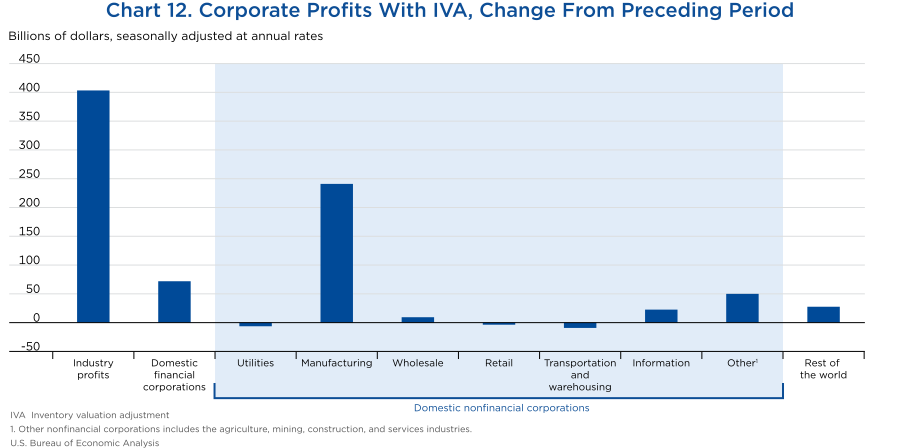
- Measured in current dollars, industry profits (corporate profits by industry with IVA) increased $403.3 billion in the second quarter.
- Domestic financial profits increased $71.9 billion, domestic nonfinancial profits increased $303.8 billion (led by petroleum and coal products), and rest-of-the-world profits increased $27.6 billion.
- The release schedule for the second quarter of 2026 includes the advance estimate of GDP on July 30, 2026; the second estimate of GDP and preliminary corporate profits on August 26, 2026; and the third estimate of GDP, GDP by industry, revised corporate profits, and state statistics on September 30, 2026.
- Real estimates are in chained (2017) dollars, and price indexes are chain-type measures. Quarterly estimates are expressed at seasonally adjusted annual rates, which reflect a rate of activity for a quarter as if it were maintained for a year.
- In this essay, “consumer spending” refers to “personal consumption expenditures,” “investment” refers to “private fixed investment” and “change in private inventories,” and “government spending” refers to “government consumption expenditures and gross investment.”
- Refer to “What is gross output by industry and how does it differ from gross domestic product (or value added) by industry?” for more information.
Suggested citation
Dorian L. Turner and Aya Hamano, “Charting the Economy: Second Quarter 2026,” Survey of Current Business (October 8, 2026), https://doi.org/10.66137/UGJW7999.
