

BEA's Economic Accounts, Part 4
Tracking America's Economy, One Region at a Time
Understanding how economic activity is distributed across the nation is essential for shaping effective policies, guiding business decisions, and advancing economic research. The U.S. Bureau of Economic Analysis (BEA) Regional Economic Accounts (REAs) support this need by providing comprehensive statistics on the geographic distribution of U.S. economic activity across states and local areas (counties and county equivalents). These accounts extend BEA's national economic statistics to more detailed geographic levels, offering a consistent framework for analyzing economic conditions across U.S. states and local areas.
The REAs are constructed using a wide array of data sources, including economic surveys, administrative records, and private-sector data. BEA integrates and harmonizes these data to produce key regional statistics such as personal income (PI) and gross domestic product (GDP) by state and county, personal consumption expenditures (PCE) by state, and regional price parities (RPPs). The methodology used ensures regional estimates are consistent with the national statistics in the National Economic Accounts (NEAs), comparable across geographic areas, and reflect the distinct economic characteristics of each area.
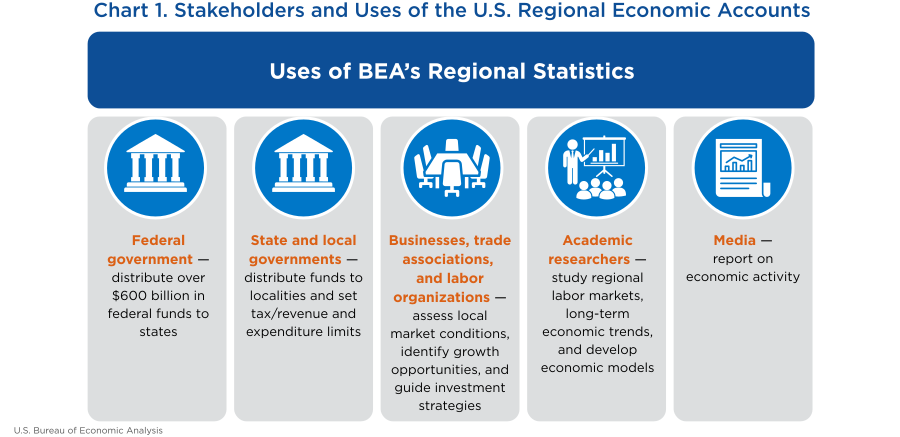
BEA's regional statistics are widely used to support economic research and data-driven decision-making (chart 1). The federal government relies on BEA's REA statistics to distribute more than $600 billion annually to states through programs such as Medicaid, the Child Care and Development Fund, and the National School Lunch Program. State and local governments use them to allocate resources to counties and municipalities, set tax and revenue limits, and plan expenditures. Businesses, trade associations, and labor organizations use regional data to assess local market conditions, identify growth opportunities, and guide investment strategies. Academic researchers rely on these statistics to study regional disparities, labor markets, and long-term economic trends, while the media uses them to report on economic activity and explain how local economies connect to the national picture.
Like BEA's NEAs and International Economic Accounts (IEAs), the REAs are guided by three core principles: comprehensiveness, integration, and consistency. These principles ensure the REAs present a relevant, timely, and accurate picture of state and local economic activity within the broader national economy. This article provides a brief overview of the history behind their development and examines the REAs through the lens of these guiding principles.
The development of regional economic statistics began in the mid-1930s at the Bureau of Foreign and Domestic Commerce, predecessor to BEA, as part of a broader initiative to better understand the structure of the U.S. economy. A major milestone came in 1939 with the publication of the first state-level estimates of “income payments to individuals,” a measure that included wages, entrepreneurial income, and property income (dividends, interest, and net rents and royalties). These early estimates evolved into the more comprehensive state personal income (SPI) measure, first published in the September 1955 issue of the Survey of Current Business, laying the foundation for what would become today's REAs. State disposable personal income estimates followed in 1956.
During the 1960s and 1970s, BEA expanded the scope of regional statistics with the introduction of quarterly SPI estimates in 1966 and the development of personal income statistics for counties and metropolitan areas. By the 1970s, BEA was regularly publishing personal income and employment statistics for states, counties, and metro areas. In the 1980s, BEA introduced GDP by state and industry, adding production statistics at the state level. Through the 1990s and 2000s, BEA focused on refining its methodologies and improving timeliness and detail, paving the way for more than a decade of rapid innovation.
BEA has an established process of developing new statistical products through a structured and iterative process that focuses on innovation, transparency, subject-matter expertise, and stakeholder engagement. It begins with experimental statistics—early-stage estimates developed to test concepts and methods and that are released to gauge interest and gather feedback. These estimates often rely on incomplete data sources and preliminary methods. Based on internal evaluation and expert feedback, BEA then refines the methodology and incorporates more robust data sources, advancing to prototype statistics. These are more consistent and reliable but may still undergo major methodology changes. Finally, after rigorous review and validation and meeting publication quality standards, the product becomes an official statistic, fully integrated into BEA's regular releases and maintained through ongoing methodology improvements and data updates. At times, new statistical products are developed in partnership with other federal agencies to leverage expertise and resources.
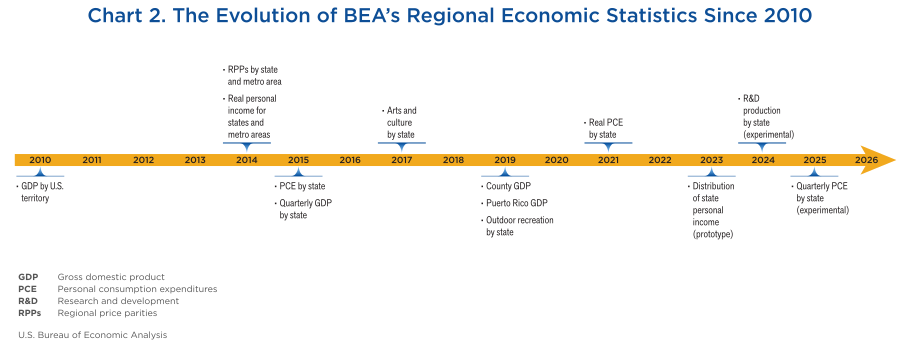
Since 2010, BEA has significantly broadened the scope and depth of its REAs, introducing new statistical products that offer richer and more nuanced insights into state and local economies (chart 2). That year, BEA expanded the REAs to include U.S. territories, publishing data for American Samoa, Guam, the Commonwealth of the Northern Mariana Islands, and the U.S. Virgin Islands.1
Other major innovations soon followed. In 2014, BEA released official statistics on RPPs—critical data for assessing real purchasing power and comparing price levels across geographical areas—and real personal income for states and metro areas.2 In 2015, BEA released official statistics on annual PCE by state, offering a detailed view of consumer spending patterns across states, along with quarterly GDP by state, marking a major step forward in timeliness.3 County-level GDP statistics published in 2019 added geographic granularity essential for uncovering local production patterns often obscured in broader state-level statistics and aligned county-level income with production.4 That same year, BEA published the first GDP statistics for Puerto Rico to support recovery efforts after hurricanes Irma and Maria and inform policy decisions related to the island's debt crisis. Real PCE by state was added in 2021.
Beyond core measures, BEA expanded its regional data offerings through supplemental statistics that measure the economic contribution of specific sectors such as arts and culture and outdoor recreation.5 More recent innovations include prototype distributional measures of SPI in 2023 and in 2024, experimental statistics on research and development (R&D) production by state.6 These new statistics show how personal income is distributed across households in each state and how R&D activities contribute to each state's economy. In 2025, BEA introduced experimental statistics on quarterly PCE by state in a working paper. Additional history of the Regional program and challenges unique to the development of regional statistics are discussed in a centennial issue of the Survey. These developments reflect BEA's ongoing commitment to innovation and to delivering more granular, timely, and relevant regional economic data.
The REAs are built on the same foundational principles that guide all of BEA's economic accounts: comprehensiveness, integration, and consistency. These principles ensure the REAs provide a detailed, multidimensional view of regional economies, are interconnected through shared data and methodologies, and apply standardized definitions and consistent data and methods across regional estimates.
Comprehensiveness
The REAs present a comprehensive view of regional economic activity through a wide range of core economic measures. These include GDP and PI by state and county, PCE by state, and RPPs. Together, these measures capture key dimensions of state and local economies: production, income, consumer spending, and price-level differences across geographical areas.
The REAs offer extensive geographic coverage, encompassing all 50 states, the District of Columbia, and every U.S. county and county-equivalent—more than 3,000 in total. This level of granularity enables data users to build customized regional groupings, such as metropolitan and nonmetropolitan areas, or define other geographies tailored to specific analytical needs.
They also break down key industries, income components, and spending categories. GDP is disaggregated by industry, highlighting contributions from sectors like manufacturing, health care, and financial services. At the state level, GDP statistics are available for over 60 detailed industries and more than 20 industries at the county level. Personal income statistics offer even greater detail, breaking down the sources of income: wages and salaries; supplements to wages and salaries; proprietors' income; dividends, interest, rent, and royalties; and government transfer payments. Earnings (wages and salaries plus supplements to wages and salaries plus proprietors' income) are reported by both place of work and place of residence with detail by industry for the place-of-work statistics. PCE provides data on over 70 categories of goods and services, including housing and utilities, health care, food services, and durable goods showing how households allocate their spending among these categories and how consumption trends shift over time.
The REAs include annual and quarterly statistics, along with long historical series that support analyses of both short-term and long-term economic trends. SPI statistics are available as far back as 1929, while county-level PI statistics go back to 1969. GDP statistics are available starting in 1997 for states and in 2001 for counties, and PCE by state statistics are available from 1997 onward. In addition, the REAs feature both nominal and real (inflation-adjusted) measures, enabling meaningful comparisons across regions and over time.
Finally, in addition to the core measures, the REAs also include valuable supplemental data and tools that support deeper regional economic analyses. For example, statistics on distribution of state personal income show how income is shared among households within each state, while the Regional Input-Output Modeling System (RIMS) II multipliers help estimate the economic impact of specific projects at the regional level.
Integration
The REAs are integrated across three dimensions: with the NEAs, with the IEAs, and internally within the REAs themselves. This integration is essential for ensuring methodological coherence across all measures of economic activity, enabling users to directly link regional performance to the national economy.
Integration with NEAs
The REAs are closely integrated with the NEAs through shared concepts, definitions, classifications, and the framework of national accounting. Regional estimates are developed using methodologies that align with the NEAs, which consist of the National Income and Product Accounts (NIPAs) and the Industry Economic Accounts. Wherever possible, the REAs also draw from the same source data.
For some measures, such as housing services, wages and salaries, and farm income, detailed geographic data allow for bottom-up estimation at highly disaggregated levels. These estimates are then aggregated to regional and national levels, reflecting a cohesive and integrated methodology. For other measures, the data used for the national estimates lack sufficient geographic detail. In these cases, a top-down approach is applied, using alternative data sources to develop regional allocators that distribute national totals across states and counties. In both approaches, consistency with the NEAs is maintained by applying the same conceptual framework and benchmarking the regional estimates to ensure they sum to the national totals. This benchmarking process is applied universally, including to bottom-up estimates, to ensure any adjustments are fully reflected in both national and regional accounts.
Despite these efforts, slight differences between regional and national statistics may occur, primarily due to residency definitions. In the NIPAs, a U.S. resident is defined as someone with a center of economic interest in the United States who resides, or expects to reside, in the country for 1 year or more. This includes U.S. citizens living abroad for less than a year, federal personnel stationed overseas, and foreign nationals if they live and work in the United States for a year or more. In contrast, the REAs define residency based on actual residence within a state, regardless of citizenship or duration, except for foreign nationals employed by their home governments. This narrower definition excludes economic activity that cannot be assigned to a specific state resulting in minor discrepancies between regional and national totals. For example, SPI excludes the income of military personnel on foreign assignment, and GDP by state excludes federal military and civilian activity overseas.
Integration with IEAs
Integration between the REAs and the IEAs is more limited but includes a few notable areas of overlap. One example is cross-border income flows, such as the compensation earned by U.S. residents commuting to work in Canada and by Canadian and Mexican residents commuting to work in the United States. These flows are captured in the IEAs and reflected in the REAs through residence adjustments to accurately measure the income earned by U.S. residents in border regions. Another area of overlap involves expenditures on foreign travel by U.S. residents and expenditures by nonresidents, such as international visitors who travel, work temporarily, attend school, or receive medical treatment in the United States. These expenditures are particularly important to states with high volumes of international tourism.
Integration within REAs
A third area of integration occurs within the REAs themselves, where components are linked through shared data inputs and estimation methods (chart 3). At the national level, GDP is estimated using three approaches: expenditure (as the sum of goods and services sold to final users), income (as the sum of income payments and other costs incurred in production), and value added (as the sum of value added at each stage of production). At the state and county levels, however, GDP is estimated using an income approach, due to limited regional data for the other methods. Under this approach, GDP is estimated as the sum of the income generated by the three primary factors of production: labor, capital, and government. As a result, the compensation of employees, a component of state and county PI, feeds directly into GDP calculations. This internal integration ensures labor income is consistently reflected across both PI and GDP measures.
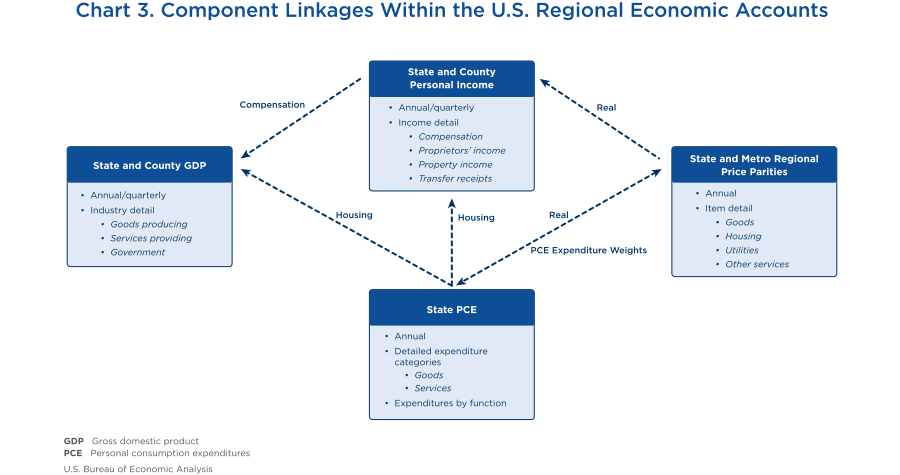
Housing services provide another example of integration across PCE, PI, GDP, and RPPs within the REAs. In PCE, housing services are one of the largest categories of household consumption, capturing the value of shelter for both renters (actual rent) and homeowners (imputed rent). The rent imputation for homeowners treats them as if they are paying rent to themselves, ensuring the measurement of consumption of housing services is the same across tenure types. In PI, rental payments generate income for landlords, while imputed rent represents a noncash economic benefit for homeowners. In GDP, housing services contribute to the output of the real estate sector, and in RPPs, regional differences in housing costs are a major driver of price-level variation. The REAs include an integrated set of housing estimates that align housing-related expenditures, income, and production, while PCE housing services serve as the expenditure weights for the housing RPPs. This integrated approach avoids duplication, minimizes inconsistencies, and enhances the analytical value of the REAs by presenting a coherent picture of the contribution of the housing sector to regional economies.
Geography is another key aspect of internal integration. The assignment of economic activity to a specific location depends on the type of measure, with an important distinction between place of work and place of residence. Place of work refers to the location where production occurs and earnings are generated. In the REAs, GDP, employment, and earnings are reported on this basis. Place of residence reflects where individuals live, regardless of where they work, a distinction particularly important for regions with significant commuting flows. PI and PCE are reported by place of residence, using the same definition of residence to ensure income and consumption correspond to the same population. This alignment in geography is important for understanding how output, income, and consumption are distributed across the U.S. economy.
Looking ahead, as BEA advances its research into developing expenditure-based measures of GDP by state, deeper integration across all three dimensions will be essential. For example, integrating trade components, such as state-level imports and exports of goods and services, with international trade data in the IEAs will improve consistency and ensure a more accurate picture of regional economic activity within the broader U.S. and global economies.
Consistency
The REAs apply uniform concepts, definitions, classifications, and a consistent accounting framework across all states and counties. They also rely on common data sources, such as U.S. Census Bureau surveys, Internal Revenue Service tax records, and U.S. Bureau of Labor Statistics employment data. This standardization ensures any given measure like GDP or PI is calculated the same way, allowing for direct comparisons between regions regardless of differences in population, economic activity, or industrial structure.
In addition to geographic consistency, the REAs maintain temporal consistency by regularly updating source data and methodologies. When new national or regional data become available, corresponding regional statistics are updated to reflect the latest information. Likewise, any methodological changes, whether at the national or regional level, are incorporated and carried back to the beginning of the time series to ensure continuity. This approach allows users to analyze trends over time, such as tracking the growth of a sector like health care in a specific state or comparing income growth across decades.
Finally, a distinctive feature of consistency in the REAs is the use of RPPs to account for differences in price levels when comparing economic activity across geographical areas. For example, a dollar in a high-cost area like New York City does not have the same purchasing power as a dollar in a lower-cost area like rural Mississippi. By incorporating RPPs, real (inflation-adjusted) comparisons reflect true economic differences rather than variations in local cost of living.
BEA's REAs are far more than a collection of statistics—they are an essential tool for understanding the dynamics that shape state and local economies across the United States. By extending the national accounts to states and counties, the REAs provide the geographic detail needed to uncover economic patterns and trends that national aggregates often obscure. Built on the principles of comprehensiveness, integration, and consistency, the REAs offer a consistent framework for analyzing economic conditions, ensuring meaningful comparisons over time and across areas, while linking local economies to the broader national economy.
Over the years, BEA has systematically expanded and refined these accounts to meet the growing demand for accurate, timely, and detailed regional data. Decades of methodological innovation have transformed them into a comprehensive set of regional statistics that has become indispensable to many stakeholders. They help policymakers assess local economic conditions, shape development strategies, and allocate federal resources. Businesses use these data to assess market potential, identify growth opportunities, and plan investments. Researchers use them to study regional disparities, labor markets, and long-term economic trends. From guiding recovery efforts after natural disasters to shaping business investments, the REAs provide the data foundation for decisions that affect communities nationwide. By providing reliable, geographically detailed data, the REAs offer a clearer picture of the national economy and support informed decision-making at all levels.
- Statistics for the U.S. territories were developed in partnership with the U.S. Department of the Interior Office of Insular Affairs. For details on these statistics, including those for Puerto Rico, see “States and Territories.”
- BEA introduced its first experimental RPPs in 2005, followed by prototype statistics in 2008. For additional information, see “Regional Price Parities by State and Metro Area.”
- Experimental PCE by state statistics were released in a 2013 working paper, with prototype statistics published in 2014. Quarterly GDP by state was first released in September 2015. For more information, see “Consumer Spending by State” and “GDP by State.”
- Experimental GDP estimates for a subset of counties were published in a 2016 working paper, with prototype estimates for all counties first published in 2018. See ”GDP by County” for further details.
- For additional information on these statistics, see “Arts and Culture” and “Outdoor Recreation.”
- More details on the distributional measures of SPI are available at “Distribution of Personal Income.” R&D production by state statistics are developed in partnership with the National Science Foundation's National Center for Science and Engineering Statistics. See “Research and Development” for more information.
Suggested citation
Ledia Guci and Mauricio Ortiz, “BEA's Economic Accounts, Part 4: Tracking America's Economy, One Region at a Time,” Survey of Current Business (September 17, 2026), https://doi.org/10.66137/QTZN5320.
