
The 2021 Annual Update of the National Income and Product Accounts
The Bureau of Economic Analysis (BEA) released its annual update of the National Income and Product Accounts (NIPAs) on July 29. The update of the NIPAs covered the first quarter of 1999 through the first quarter of 2021 and resulted in revisions to gross domestic product (GDP), gross domestic income (GDI), and their components. The reference year for price and quantity estimates remains 2012. In cases for which the estimates for the reference year (2012) are revised, there are revisions to the levels of the related index numbers and chained-dollar estimates for the entire historical period; however, revisions to percent changes before the first quarter of 1999 are zero or very small.
As is usual for annual updates, the revised estimates reflect newly available source data that are more complete, more detailed, and otherwise more reliable than those that were previously incorporated.

[Click chart to expand]
In this year's update, BEA adopted a new methodology to improve the accuracy and reliability of the estimates for housing services. BEA also extended back to 1999 several improvements that were introduced in last year's update to align the NIPAs with BEA's International Transactions Accounts (ITAs).1
With this update, economic growth from 2015 to 2020 is unchanged (chart 1):
- Real GDP—an inflation-adjusted measure of the value of the goods and services produced by the nation's economy less the value of the goods and services used up in production—increased at an average annual rate of 1.1 percent, the same as previously published.
- Real GDI—which measures the value of the production of goods and services in the United States as the incomes earned and the costs incurred in production—increased at an average annual rate of 1.0 percent; in the previously published estimates, real GDI increased at an average annual rate of 0.9 percent.
- The average of real GDP and real GDI increased at an average annual rate of 1.1 percent; in the previously published estimates, the measure increased at an average annual rate of 1.0 percent.
- The price index for gross domestic purchases increased at an average annual rate of 1.5 percent, unrevised from the previously published estimates.
- Contributors to changes in real GDP growth for 2016–2020 are little changed from the previously published estimates. Consumer spending remains the driving force behind the change in GDP in all years. Revised estimates show that the contribution of private investment was stronger in 2019 than previously shown, while the contribution of consumer spending was weaker. In 2020, the contribution of government spending was stronger than previously shown, mitigating the decrease in real GDP, while exports and private investment contributed more negatively than previously shown.
- For the period of expansion from the second quarter of 2009 through the fourth quarter of 2019, real GDP increased at an average annual rate of 2.3 percent, unrevised from the previously published estimate. The rate of growth in real GDI over this period was also unrevised at 2.4 percent. For the period of contraction from the fourth quarter of 2019 through the second quarter of 2020, real GDP decreased at an average annual rate of −19.2 percent, unrevised from the previous estimates. The rate of change in real GDI over this period was −18.3 percent; in previously published estimates, the rate of change was −18.9 percent. For the period of expansion from the second quarter of 2020 through the first quarter of 2021, real GDP increased at an average annual rate of 14.1 percent; in the previously published estimates, real GDP increased 14.0 percent. The rate of growth in real GDI over this period was 16.5 percent; in previously published estimates, the measure increased 16.8 percent.
- The personal saving rate—personal saving as a percentage of disposable personal income—was revised up 0.1 percentage point to 7.0 percent for 2016 and up 0.1 percentage point to 7.3 percent for 2017. It was revised down 0.2 percentage point to 7.6 percent for 2018 and revised up 0.1 percentage point to 7.6 percent for 2019. For 2020, it was revised up 0.2 percentage point to 16.6 percent.
The updated NIPA estimates reflect the incorporation of newly available and revised source data, the adoption of improved estimating methods, and for quarterly and monthly measures, the incorporation of updated seasonal adjustment factors.
Major source data
The major source data incorporated as part of this year's update are summarized in table 1, and additional information on the NIPA components affected by the incorporation of newly available and revised source data is provided in table 13.
Source data that affected the NIPA components include the following:
- New Census Bureau American Community Survey (ACS) data for 2019 and newly incorporated ACS data for 2005–2018, which impacted estimates of consumer spending for housing services and estimates of rental income of persons.
- Revised Census Bureau Service Annual Survey (SAS) data for 2016–2019, which replaced previously incorporated SAS data. SAS data most notably impacted estimates of consumer spending for services and estimates of private fixed investment in intellectual property products.
- Revised Internal Revenue Service (IRS) tabulations of corporate tax returns for 2018 and new IRS tabulations of tax returns data for 2019 for corporations, sole proprietorships, and partnerships, which affected estimates of corporate profits, proprietors' income, and net interest.
- Revised Economic Census data for 2017 and new Census Bureau Annual Survey of Manufactures (ASM) data for 2019, which replaced Census Bureau monthly industry shipments and inventories data, and revised monthly industry shipments and inventories data for 2016–2020, all of which impacted estimates of private investment in equipment and inventories.
- New Census Bureau Annual Retail Trade Survey (ARTS) data for 2019, which replaced Census Bureau Monthly Retail Trade Survey (MRTS) data, and revised ARTS data for 2016–2018, both of which impacted estimates of consumer spending for goods and private inventory investment.
- Revised Bureau of Labor Statistics (BLS) Quarterly Census of Employment and Wages (QCEW) data for 2016–2020, which impacted estimates of private and government compensation.
- Revised Department of Agriculture farm statistics for 2016–2020, which impacted estimates of farm output, inventory investment, and proprietors' income.
- Revised BEA International Transactions Accounts data for 2013–2020, which impacted estimates of exports and imports of goods and services and income flows with the rest of the world.
| Agency | Data | Years covered and vintage |
|---|---|---|
| Census Bureau | Annual Capital Expenditures Survey | 2018 (revised) 2019 (new) |
| Annual Wholesale Trade Survey | 2016–2018 (revised) 2019 (new) |
|
| Annual Retail Trade Survey | 2016–2018 (revised) 2019 (new) |
|
| Annual Survey of Manufactures | 2018 (revised) 2019 (new) |
|
| Economic Census | 2017 (revised) | |
| Monthly indicators of manufactures, merchant wholesale trade, and retail trade | 2016–2020 (revised) | |
| Service Annual Survey | 2016–2019 (revised) | |
| Annual Survey of State and Local Government Finances | Fiscal years 2016–2018 (revised) Fiscal year 2019 (new) |
|
| Annual Survey of Public Employment & Payroll | Calendar years 2019 (revised) and 2020 (new) | |
| Monthly survey of construction spending (value put in place) | 2016–2020 (revised) | |
| Quarterly Services Survey | 2016–2020 (revised) | |
| American Community Survey | 2019 (new) | |
| Current Population Survey/Housing Vacancy Survey | 2016–2019 (revised) 2020 (new) |
|
| Office of Management and Budget | Federal budget | Fiscal years 2018–2020 |
| Internal Revenue Service | Tabulations of tax returns for corporations | 2018 (revised) 2019 (new) |
| Tabulations of tax returns for sole proprietorships and for partnerships | 2019 (new) | |
| Bureau of Labor Statistics | Quarterly Census of Employment and Wages | 2016–2020 (revised) |
| Occupational Employment and Wage Statistics program | 2020 (new) | |
| Department of Agriculture | Farm statistics | 2016–2020 (revised) |
| Bureau of Economic Analysis | International Transactions Accounts | 2013–2020 (revised) |
Methodology improvements
This year's update reflects methodological changes to several of BEA's measures.
Housing services. Beginning with 2002, annual measures of personal consumption expenditures (PCE) on housing services and of rental income of persons are improved by using microdata on housing units from the ACS.2 The ACS data provide a single official statistical source for estimates of individual housing units and facilitate a more transparent methodology. The method continues to rely on BLS Consumer Price Indexes (CPIs) to deflate tenant-occupied housing services and owner-occupied housing services. Previously, NIPA measures of housing services were estimated at the national level using multiple data sources, including benchmark data from the last year (2001) of the Census Bureau's discontinued Residential Finance Survey.
The new method harmonizes the measures of housing services across BEA's national and regional programs, as it will also be reflected in the upcoming updates to the Industry Economic Accounts (IEAs) and the Regional Economic Accounts.3
Personal consumption expenditures on financial services. BEA's measures of personal spending on financial service charges, fees, and commissions are improved through the introduction of the BLS Producer Price Index (PPI) for “other securities related services including margin lending and mutual fund sales” to deflate the underlying measures of PCE for mutual fund sales. Previously, the deflation of mutual fund sales reflected trade source data and the BLS CPIs for all items.
Extension of previous improvements to prior periods. With this update, BEA carried back to 1999 several methodology improvements that were introduced for a more limited timespan as part of last year's annual update.4
Services furnished without payment by financial intermediaries. The NIPA measures of imports of services furnished without payment by financial intermediaries are now fully harmonized with the corresponding measures from BEA's ITAs. Beginning with 1999, the NIPAs now record measures of both imports and exports of these “implicit” services as financial services. As part of last year's annual update of the NIPAs, imports of these services were introduced back to 2015 and were recorded as part of “other” services; prior to last year's update, only exports of these services were recorded.5 As both exports and imports of these services are now recognized in both the ITAs and the NIPAs back to 1999, the NIPA and ITA measures of receipts and payments of imputed interest related to these implicit services are fully reconciled. Previously, adjustments for “imputed interest to (or from) the rest of the world” were required to reconcile the ITA and NIPA measures.
Treasury Inflation-Protected Securities. Beginning with 1999, the accuracy and consistency of NIPA measures of Treasury Inflation-Protected Securities (TIPS) are improved by recording quarterly and annual federal government payments of interest on TIPS on an accrual basis and by introducing a more consistent allocation of the inflation adjustment to annual measures of interest paid to businesses, persons, and the rest of the world. As part of last year's annual update, these improvements were introduced beginning with 2015.
Improved prices. Beginning with 1999, measures of exports and imports of telecommunications, computer, and information services are improved through the use of a composite price index of BLS PPIs. Additionally, measures of exports and imports of maintenance and repair services are improved through the use of the BLS PPI for commercial and industrial machinery and equipment repair and maintenance. As part of the 2019 annual update, the use of these indexes was introduced beginning with 2014.
Presentational improvements and classificational changes
This year's annual update introduces several presentational improvements. First, a new reconciliation table (NIPA table 4.3C) reflects the improved alignment of the NIPAs and the ITAs that results from the recognition in the ITAs of exports and imports of financial services provided without payment, which was introduced as part of the 2020 ITA annual update. This new table and existing NIPA tables also reflect the reclassification of several categories of exports and imports in the NIPAs. Specifically, as noted above, exports and imports of implicit financial services are now classified as financial services; previously, they were recorded as part of other services. Additionally, exports and imports of personal, cultural, and recreational services and of construction services are now recorded as separate categories of “other business services” in the underlying detail tables (NIPA tables 4.2.3U through 4.2.6U). Previously, these measures were unpublished components of the “other” category of other business services.
Measures of current-dollar GDP were revised down for 2016–2018 and revised up for 2019–2020; from 2015 to 2020 current-dollar GDP increased at an average annual rate of 2.8 percent (unrevised from previously published estimates).
From 2015 to 2020, real GDP increased at an average annual rate of 1.1 percent, the same as the prior estimate. Real GDP growth was unrevised for 2016 and 2017, revised down 0.1 percentage point for 2018, revised up 0.1 percentage point for 2019, and revised up 0.1 percentage point for 2020 (table 2). The revisions to real GDP and its components primarily reflect revisions to current-dollar measures; price measures were not significantly revised.
- For 2016, upward revisions to nonresidential fixed investment, private inventory investment, state and local government spending, and exports and a downward revision to imports (a subtraction in the calculation of GDP) were offset by downward revisions to PCE and to federal government spending.
- For 2017, upward revisions to nonresidential fixed investment, private inventory investment, and exports and a downward revision to imports were offset by downward revisions to PCE and to state and local government spending.
- For 2018, downward revisions to state and local government spending, nonresidential fixed investment, private inventory investment, and exports were partly offset by upward revisions to PCE and federal government spending.
- For 2019, upward revisions to nonresidential fixed investment, private inventory investment, and residential fixed investment were partly offset by downward revisions to PCE and federal government spending and by an upward revision to imports.
- For 2020, upward revisions to state and local government spending, private inventory investment, PCE and federal government spending and residential fixed investment were partly offset by downward revisions to nonresidential fixed investment and exports and by an upward revision to imports.
| Line | Series | Share of current-dollar GDP (percent) | Change from preceding period (percent) | Contribution to percent change in real GDP (percentage points) | ||||||||
|---|---|---|---|---|---|---|---|---|---|---|---|---|
| 2020 | 2016 | 2017 | 2018 | 2019 | 2020 | 2016 | 2017 | 2018 | 2019 | 2020 | ||
| 1 | Gross domestic product1 | 100.0 | 1.7 | 2.3 | 2.9 | 2.3 | −3.4 | 1.7 | 2.3 | 2.9 | 2.3 | −3.4 |
| 2 | Personal consumption expenditures | 67.2 | 2.5 | 2.4 | 2.9 | 2.2 | −3.8 | 1.67 | 1.65 | 1.96 | 1.48 | −2.55 |
| 3 | Goods | 22.3 | 3.4 | 3.9 | 4.0 | 3.4 | 4.6 | 0.73 | 0.82 | 0.84 | 0.71 | 0.96 |
| 4 | Durable goods | 7.7 | 5.4 | 6.3 | 7.0 | 4.3 | 7.7 | 0.38 | 0.44 | 0.49 | 0.30 | 0.54 |
| 5 | Nondurable goods | 14.5 | 2.5 | 2.7 | 2.5 | 2.9 | 3.1 | 0.35 | 0.38 | 0.35 | 0.40 | 0.42 |
| 6 | Services | 45.0 | 2.0 | 1.8 | 2.4 | 1.7 | −7.5 | 0.94 | 0.83 | 1.13 | 0.78 | −3.52 |
| 7 | Gross private domestic investment | 17.4 | −1.0 | 4.0 | 5.7 | 3.4 | −5.5 | −0.18 | 0.68 | 0.98 | 0.60 | −0.99 |
| 8 | Fixed investment | 17.7 | 2.1 | 4.1 | 4.8 | 3.2 | −2.7 | 0.35 | 0.69 | 0.82 | 0.55 | −0.47 |
| 9 | Nonresidential | 13.4 | 0.9 | 4.1 | 6.4 | 4.3 | −5.3 | 0.12 | 0.53 | 0.85 | 0.59 | −0.73 |
| 10 | Structures | 2.9 | −4.3 | 4.2 | 4.0 | 2.0 | −12.5 | −0.14 | 0.13 | 0.12 | 0.06 | −0.39 |
| 11 | Equipment | 5.4 | −1.8 | 2.8 | 6.4 | 3.3 | −8.3 | −0.11 | 0.16 | 0.36 | 0.19 | −0.48 |
| 12 | Intellectual property products | 5.2 | 8.8 | 5.7 | 8.1 | 7.2 | 2.8 | 0.37 | 0.25 | 0.36 | 0.33 | 0.14 |
| 13 | Residential | 4.3 | 6.6 | 4.0 | −0.6 | −0.9 | 6.8 | 0.23 | 0.15 | −0.02 | −0.04 | 0.26 |
| 14 | Change in private inventories | −0.3 | --- | --- | --- | --- | --- | −0.53 | −0.01 | 0.16 | 0.05 | −0.52 |
| 15 | Net exports of goods and services | −3.1 | --- | --- | --- | --- | --- | −0.17 | −0.16 | −0.27 | −0.18 | −0.29 |
| 16 | Exports | 10.2 | 0.4 | 4.1 | 2.8 | −0.1 | −13.6 | 0.05 | 0.49 | 0.35 | −0.01 | −1.57 |
| 17 | Goods | 6.8 | 0.6 | 4.1 | 4.2 | −0.1 | −10.2 | 0.05 | 0.32 | 0.34 | 0.00 | −0.76 |
| 18 | Services | 3.4 | 0.0 | 4.0 | 0.2 | −0.1 | −19.8 | 0.00 | 0.17 | 0.01 | 0.00 | −0.81 |
| 19 | Imports | 13.3 | 1.5 | 4.4 | 4.1 | 1.2 | −8.9 | −0.22 | −0.65 | −0.62 | −0.17 | 1.28 |
| 20 | Goods | 11.1 | 1.1 | 4.5 | 5.1 | 0.5 | −5.6 | −0.14 | −0.53 | −0.62 | −0.07 | 0.65 |
| 21 | Services | 2.2 | 3.0 | 4.3 | 0.0 | 3.9 | −22.6 | −0.08 | −0.12 | 0.00 | −0.11 | 0.63 |
| 22 | Government consumption expenditures and gross investment | 18.5 | 2.0 | 0.5 | 1.4 | 2.2 | 2.5 | 0.35 | 0.09 | 0.24 | 0.38 | 0.43 |
| 23 | Federal | 7.2 | 0.5 | 0.3 | 3.0 | 3.8 | 5.0 | 0.03 | 0.02 | 0.20 | 0.25 | 0.33 |
| 24 | National defense | 4.2 | −0.6 | 0.9 | 3.4 | 5.2 | 2.9 | −0.02 | 0.04 | 0.13 | 0.20 | 0.11 |
| 25 | Nondefense | 3.0 | 2.1 | −0.5 | 2.5 | 1.6 | 8.1 | 0.06 | −0.01 | 0.07 | 0.04 | 0.21 |
| 26 | State and local | 11.3 | 2.8 | 0.6 | 0.4 | 1.3 | 0.9 | 0.31 | 0.07 | 0.04 | 0.14 | 0.10 |
| Revisions (percentage points) | ||||||||||||
| 27 | Gross domestic product | ... | 0.0 | 0.0 | −0.1 | 0.1 | 0.1 | 0.0 | 0.0 | −0.1 | 0.1 | 0.1 |
| 28 | Personal consumption expenditures | ... | −0.3 | −0.2 | 0.2 | −0.2 | 0.1 | −0.20 | −0.14 | 0.11 | −0.16 | 0.08 |
| 29 | Gross private domestic investment | ... | 0.5 | 0.5 | −0.6 | 1.7 | −0.3 | 0.09 | 0.08 | −0.10 | 0.30 | −0.07 |
| 30 | Fixed investment | ... | 0.3 | 0.3 | −0.4 | 1.3 | −0.9 | 0.05 | 0.05 | −0.06 | 0.23 | −0.16 |
| 31 | Nonresidential | ... | 0.4 | 0.4 | −0.5 | 1.4 | −1.3 | 0.05 | 0.04 | −0.06 | 0.20 | −0.19 |
| 32 | Residential | ... | 0.0 | 0.0 | 0.0 | 0.8 | 0.7 | 0.00 | 0.00 | 0.00 | 0.03 | 0.03 |
| 33 | Change in private inventories | ... | --- | --- | --- | --- | --- | 0.04 | 0.03 | −0.04 | 0.07 | 0.09 |
| 34 | Net exports of goods and services | ... | --- | --- | --- | --- | --- | 0.04 | 0.06 | −0.02 | 0.00 | −0.15 |
| 35 | Exports | ... | 0.1 | 0.2 | −0.2 | 0.0 | −0.7 | 0.01 | 0.02 | −0.01 | 0.00 | −0.10 |
| 36 | Imports | ... | −0.2 | −0.3 | 0.0 | 0.1 | 0.4 | 0.03 | 0.03 | 0.00 | −0.01 | −0.05 |
| 37 | Government consumption expenditures and gross investment | ... | 0.2 | −0.4 | −0.4 | −0.1 | 1.4 | 0.03 | −0.07 | −0.08 | −0.02 | 0.23 |
| 38 | Federal | ... | −0.1 | 0.0 | 0.2 | −0.2 | 0.7 | −0.01 | 0.00 | 0.02 | −0.01 | 0.04 |
| 39 | State and local | ... | 0.2 | −0.6 | −0.8 | 0.0 | 1.7 | 0.03 | −0.07 | −0.09 | 0.00 | 0.19 |
- The estimates under the contribution columns are also percent changes.
Note. Percent changes are from NIPA table 1.1.1, contributions are from NIPA table 1.1.2, and shares are from NIPA table 1.1.10.
The revisions did not reverse the direction of change in real GDP for any quarter in the recent revision period (the first quarter of 2016 through the first quarter of 2021). In three quarters, the revised estimates showed that real GDP accelerated, rather than decelerated; in two quarters, the revised estimates showed that real GDP decelerated, rather than accelerated, but the quarterly pattern for real GDP is similar to the previously published estimates, as illustrated in chart 2. The largest upward revision was 1.7 percentage points for the second quarter of 2019. The primary contributors to the upward revision were private investment, resulting in large part from the incorporation of revised Census Bureau data on construction spending (value put in place), manufacturers' shipments, and wholesale trade inventories. The largest downward revision was −0.7 percentage point for the first quarter of 2018. The primary contributors to the downward revision were private investment, based on revised manufacturers' shipments data, and an upward revision to imports, based primarily on revised Census data on foreign trade.

[Click chart to expand]
The updated estimates of PCE reflect a new methodology and the use of the Census Bureau's ACS for personal spending on housing services.6 Revisions to current-dollar housing services begin with 2002. The revisions are upward from the third quarter of 2007 to the second quarter of 2014; the largest upward revision to real PCE for housing is almost $49 billion for the third quarter of 2010. Revisions are downward from the third quarter of 2014 through the first quarter of 2021; the largest downward revision to real PCE for housing is almost $90 billion for the second quarter of 2019.
The updated estimates also reflect newly available and revised Census Bureau SAS data and ARTS data, revised Census Bureau MRTS data, newly available and revised Federal Reserve Board (FRB) Financial Accounts of the United States data, and newly available and revised IRS tabulations of corporate and sole proprietors and partnerships tax return data.
The change in real PCE was revised down 0.3 percentage point for 2016 and down 0.2 percentage point for 2017 and 2019. It was revised up 0.2 percentage point for 2018 and up 0.1 percentage point for 2020 (table 3).
- For 2016 and 2017, the revisions were primarily due to downward revisions to services, particularly housing services. Downward revisions to goods also contributed.
- For 2018, the upward revision was primarily due to an upward revision in services, particularly financial services and insurance.
- For 2019, the revision was due to downward revisions to both services and goods. Within services, the revision was primarily due to a downward revision to financial services and insurance; within goods, the revision was due to downward revisions across several categories.
- For 2020, the upward revision was primarily due to upward revisions to goods, particularly motor vehicles and parts and clothing and footwear. The upward revisions were partly offset by downward revisions to several categories of services.
| Line | Series | Share of current-dollar PCE (percent) | Change from preceding period (percent) | Contribution to percent change in real PCE (Percentage points) | ||||||||
|---|---|---|---|---|---|---|---|---|---|---|---|---|
| 2020 | 2016 | 2017 | 2018 | 2019 | 2020 | 2016 | 2017 | 2018 | 2019 | 2020 | ||
| 1 | Personal consumption expenditures1 | 100.0 | 2.5 | 2.4 | 2.9 | 2.2 | −3.8 | 2.5 | 2.4 | 2.9 | 2.2 | −3.8 |
| 2 | Goods | 33.1 | 3.4 | 3.9 | 4.0 | 3.4 | 4.6 | 1.09 | 1.21 | 1.24 | 1.04 | 1.43 |
| 3 | Durable goods | 11.5 | 5.4 | 6.3 | 7.0 | 4.3 | 7.7 | 0.56 | 0.65 | 0.73 | 0.44 | 0.80 |
| 4 | Motor vehicles and parts | 3.9 | 3.0 | 4.8 | 4.1 | −1.2 | 3.3 | 0.12 | 0.18 | 0.15 | −0.04 | 0.12 |
| 5 | Furnishings and durable household equipment | 2.8 | 7.7 | 7.6 | 8.2 | 3.5 | 7.6 | 0.18 | 0.18 | 0.20 | 0.09 | 0.19 |
| 6 | Recreational goods and vehicles | 3.4 | 9.1 | 9.1 | 10.9 | 12.2 | 18.2 | 0.24 | 0.24 | 0.29 | 0.33 | 0.52 |
| 7 | Other durable goods | 1.5 | 1.5 | 2.9 | 5.3 | 4.5 | −1.5 | 0.02 | 0.05 | 0.08 | 0.07 | −0.02 |
| 8 | Nondurable goods | 21.6 | 2.5 | 2.7 | 2.5 | 2.9 | 3.1 | 0.52 | 0.56 | 0.51 | 0.60 | 0.63 |
| 9 | Food and beverages purchased for off-premises consumption | 8.2 | 3.2 | 3.6 | 2.3 | 2.0 | 7.6 | 0.24 | 0.26 | 0.17 | 0.15 | 0.55 |
| 10 | Clothing and footwear | 2.6 | 2.2 | 2.0 | 2.8 | 3.0 | −4.0 | 0.07 | 0.06 | 0.08 | 0.08 | −0.11 |
| 11 | Gasoline and other energy goods | 1.8 | 0.7 | −0.5 | −0.6 | −0.1 | −13.7 | 0.02 | −0.01 | −0.01 | 0.00 | −0.29 |
| 12 | Other nondurable goods | 9.1 | 2.4 | 3.0 | 3.4 | 4.6 | 5.8 | 0.20 | 0.24 | 0.28 | 0.37 | 0.48 |
| 13 | Services | 66.9 | 2.0 | 1.8 | 2.4 | 1.7 | −7.5 | 1.39 | 1.22 | 1.66 | 1.15 | −5.21 |
| 14 | Household consumption expenditures (for services) | 63.2 | 1.9 | 1.8 | 2.3 | 2.0 | −8.6 | 1.25 | 1.21 | 1.53 | 1.28 | −5.71 |
| 15 | Housing and utilities | 19.0 | 0.5 | 0.2 | 1.5 | 0.9 | 1.0 | 0.09 | 0.03 | 0.26 | 0.17 | 0.19 |
| 16 | Health care | 16.4 | 3.8 | 2.2 | 2.6 | 3.3 | −8.4 | 0.63 | 0.37 | 0.44 | 0.55 | −1.44 |
| 17 | Transportation services | 2.6 | 4.7 | 3.8 | 4.2 | 3.4 | −25.8 | 0.15 | 0.12 | 0.14 | 0.12 | −0.87 |
| 18 | Recreation services | 3.0 | 3.0 | 1.7 | 2.0 | 1.3 | −30.1 | 0.12 | 0.07 | 0.08 | 0.05 | −1.22 |
| 19 | Food services and accommodations | 5.7 | 2.2 | 2.5 | 2.8 | 2.1 | −21.9 | 0.15 | 0.17 | 0.19 | 0.14 | −1.54 |
| 20 | Financial services and insurance | 8.5 | −2.1 | 1.9 | 1.5 | −1.1 | 0.3 | −0.17 | 0.15 | 0.12 | −0.10 | 0.02 |
| 21 | Other services | 8.0 | 3.4 | 3.6 | 3.6 | 4.2 | −9.9 | 0.28 | 0.30 | 0.30 | 0.35 | −0.84 |
| 22 | Final consumption expenditures of NPISHs | 3.7 | 4.5 | 0.4 | 4.1 | −4.2 | 16.2 | 0.14 | 0.01 | 0.13 | −0.14 | 0.50 |
| 23 | Gross output of NPISHs | 11.7 | 3.4 | s | 2.7 | 1.0 | −2.6 | 0.39 | 0.11 | 0.31 | 0.11 | −0.29 |
| 24 | Less: Receipts from sales of goods and services by NPISHs | 8.0 | 3.0 | 1.2 | 2.1 | 3.0 | −9.4 | 0.25 | 0.10 | 0.18 | 0.25 | −0.79 |
| Revisions (percentage points) | ||||||||||||
| 25 | Personal consumption expenditures | 0.0 | −0.3 | −0.2 | 0.2 | −0.2 | 0.1 | −0.3 | −0.2 | 0.2 | −0.2 | 0.1 |
| 26 | Goods | 0.2 | −0.2 | −0.1 | −0.1 | −0.3 | 0.7 | −0.05 | −0.05 | −0.02 | −0.11 | 0.25 |
| 27 | Durable goods | 0.1 | −0.4 | −0.6 | 0.2 | −0.5 | 1.4 | −0.05 | −0.07 | 0.02 | −0.07 | 0.14 |
| 28 | Nondurable goods | 0.1 | 0.0 | 0.1 | −0.2 | −0.2 | 0.5 | −0.01 | 0.02 | −0.05 | −0.04 | 0.11 |
| 29 | Services | −0.2 | −0.4 | −0.2 | 0.3 | −0.1 | −0.2 | −0.24 | −0.15 | 0.22 | −0.12 | −0.14 |
- NPISHs
- Nonprofit institutions serving households
- The estimates under the contribution columns are also percent changes.
Note. Percent changes are from NIPA table 2.3.1, contributions are from NIPA table 2.3.2, and shares are calculated from NIPA table 2.3.5.
The revisions did not reverse the direction of change in real PCE for any quarter in the recent revision period, and the quarterly pattern is similar to the previous estimates, as illustrated in chart 3. The largest upward revision to the quarterly estimates was to the fourth quarter of 2020; the largest downward revision was to the first quarter of 2019.

[Click chart to expand]
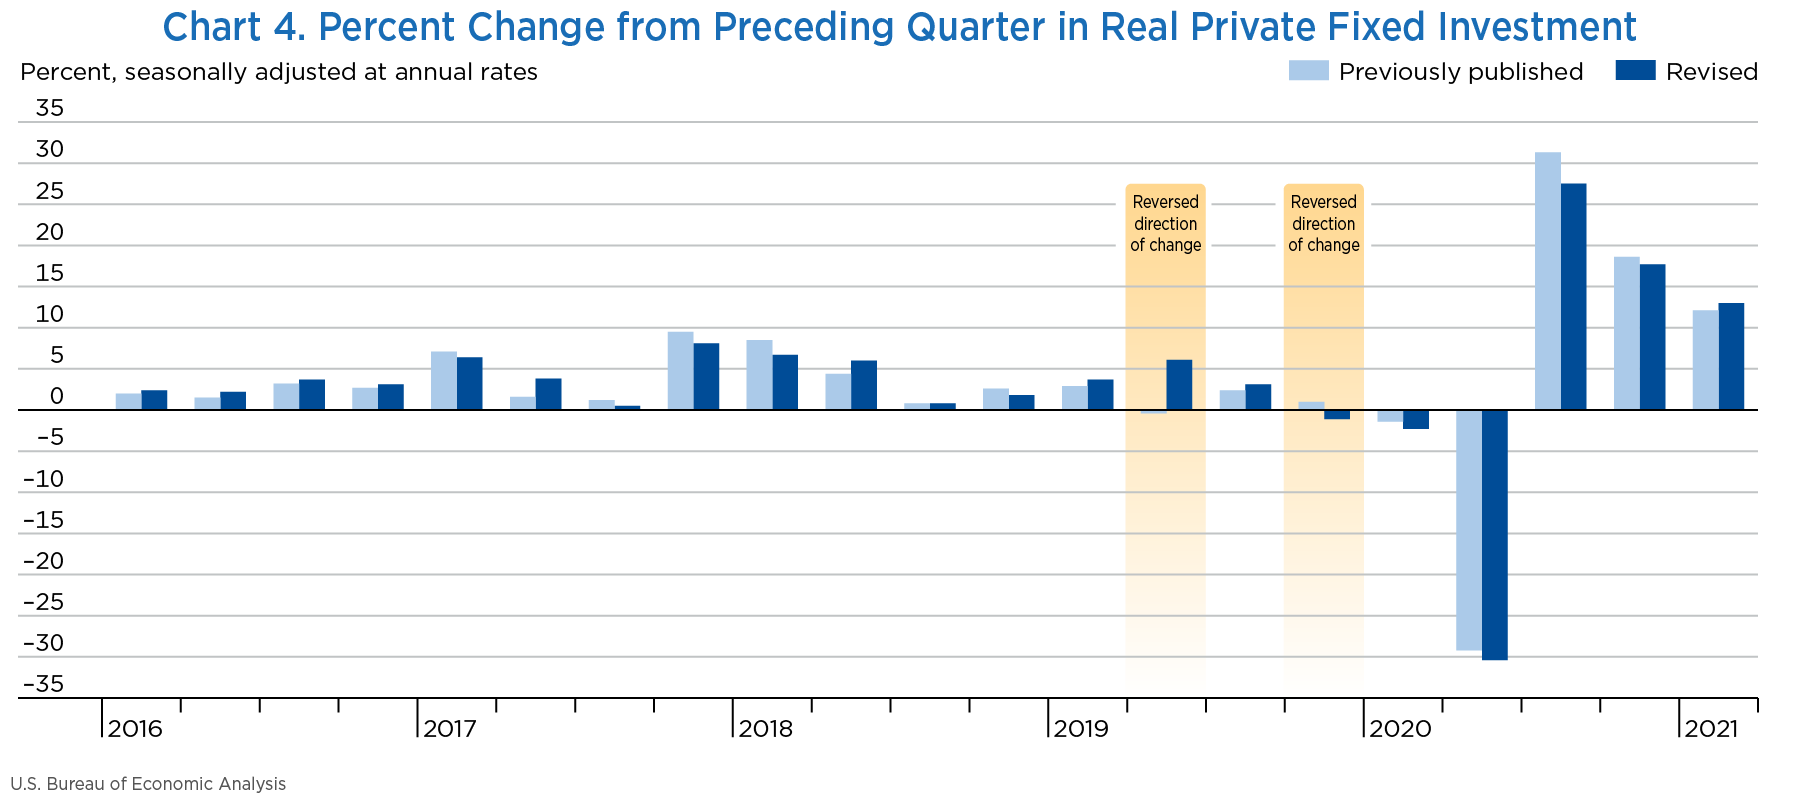
Revisions to private fixed investment primarily reflect the incorporation of source data, including revised Census Bureau construction spending (value put in place) data, newly available and revised SAS data, revised Quarterly Services Survey data, newly available ASM data, newly available and revised Economic Census data, and newly available and revised SAS data.
The change in real private fixed investment was revised up 0.3 percentage point for 2016 and 2017, down 0.4 percentage point for 2018, up 1.3 percentage points for 2019, and down 0.9 percentage point for 2020 (table 4).
- For 2016, the revision was primarily due to an upward revision to intellectual property products, particularly software.
- For 2017, the revision was primarily due to an upward revision to software that was partly offset by a downward revision to equipment.
- For 2018, the revision was primarily due to a downward revision to equipment that was partly offset by an upward revision to intellectual property products, particularly software and research and development.
- For 2019, the revision was due to upward revisions across categories, led by research and development and structures, particularly commercial and health care structures.
- For 2020, the revision was primarily due to downward revisions to equipment, particularly transportation equipment, and to nonresidential structures, particularly power and communication structures. These downward revisions were partly offset by upward revisions to intellectual property products, particularly software and research and development, and to residential structures, particularly single-family structures.
| Line | Series | Share of current-dollar PFI (percent) | Change from preceding period (percent) | Contribution to percent change in real PFI (percentage points) | ||||||||
|---|---|---|---|---|---|---|---|---|---|---|---|---|
| 2020 | 2016 | 2017 | 2018 | 2019 | 2020 | 2016 | 2017 | 2018 | 2019 | 2020 | ||
| 1 | Private fixed investment1 | 100.0 | 2.1 | 4.1 | 4.8 | 3.2 | −2.7 | 2.1 | 4.1 | 4.8 | 3.2 | −2.7 |
| 2 | Nonresidential | 75.7 | 0.9 | 4.1 | 6.4 | 4.3 | −5.3 | 0.71 | 3.16 | 4.94 | 3.37 | −4.18 |
| 3 | Structures | 16.2 | −4.3 | 4.2 | 4.0 | 2.0 | −12.5 | −0.82 | 0.75 | 0.71 | 0.37 | −2.25 |
| 4 | Commercial and health care | 5.5 | 16.7 | 3.2 | 1.3 | 1.5 | −1.4 | 0.79 | 0.17 | 0.07 | 0.08 | −0.07 |
| 5 | Manufacturing | 1.9 | −4.8 | −13.4 | −1.8 | 5.6 | −13.4 | −0.12 | −0.32 | −0.04 | 0.11 | −0.28 |
| 6 | Power and communication | 3.5 | 2.2 | −4.6 | −5.7 | 7.4 | −4.7 | 0.08 | −0.18 | −0.21 | 0.25 | −0.17 |
| 7 | Mining exploration, shafts, and wells | 2.0 | −41.8 | 39.0 | 26.9 | −1.6 | −37.5 | −1.80 | 0.94 | 0.83 | −0.06 | −1.23 |
| 8 | Other structures | 3.2 | 7.2 | 3.9 | 1.4 | −0.5 | −13.8 | 0.24 | 0.14 | 0.05 | −0.02 | −0.49 |
| 9 | Equipment | 30.4 | −1.8 | 2.8 | 6.4 | 3.3 | −8.3 | −0.63 | 0.94 | 2.11 | 1.09 | −2.71 |
| 10 | Information processing equipment | 11.2 | 4.4 | 6.8 | 7.6 | 3.7 | 6.8 | 0.49 | 0.75 | 0.82 | 0.40 | 0.71 |
| 11 | Computers and peripheral equipment | 3.5 | −0.3 | 5.7 | 13.6 | 3.2 | 10.2 | −0.01 | 0.18 | 0.42 | 0.10 | 0.32 |
| 12 | Other | 7.7 | 6.3 | 7.3 | 5.2 | 4.0 | 5.4 | 0.50 | 0.57 | 0.40 | 0.29 | 0.39 |
| 13 | Industrial equipment | 6.5 | −1.5 | 4.2 | 5.8 | 2.2 | −4.9 | −0.11 | 0.28 | 0.39 | 0.15 | −0.33 |
| 14 | Transportation equipment | 5.6 | −5.6 | −1.0 | 4.9 | 2.8 | −35.2 | −0.56 | −0.09 | 0.43 | 0.24 | −2.98 |
| 15 | Other equipment | 7.1 | −5.8 | 0.0 | 6.9 | 4.3 | −1.6 | −0.46 | 0.00 | 0.47 | 0.30 | −0.11 |
| 16 | Intellectual property products | 29.2 | 8.8 | 5.7 | 8.1 | 7.2 | 2.8 | 2.16 | 1.47 | 2.11 | 1.92 | 0.78 |
| 17 | Software | 12.3 | 10.5 | 10.9 | 11.3 | 7.0 | 7.4 | 1.04 | 1.13 | 1.22 | 0.78 | 0.83 |
| 18 | Research and development | 14.5 | 8.4 | 2.0 | 6.4 | 8.3 | 0.9 | 1.02 | 0.25 | 0.81 | 1.08 | 0.12 |
| 19 | Entertainment, literary, and artistic originals | 2.4 | 4.1 | 3.1 | 3.3 | 2.2 | −6.9 | 0.10 | 0.08 | 0.09 | 0.05 | −0.17 |
| 20 | Residential | 24.3 | 6.6 | 4.0 | −0.6 | −0.9 | 6.8 | 1.37 | 0.90 | −0.13 | −0.20 | 1.49 |
| 21 | Structures | 23.9 | 6.6 | 4.0 | −0.6 | −0.9 | 6.8 | 1.34 | 0.87 | −0.14 | −0.21 | 1.47 |
| 22 | Permanent site | 10.3 | 6.5 | 4.4 | 1.8 | −4.4 | 5.9 | 0.59 | 0.43 | 0.19 | −0.44 | 0.55 |
| 23 | Single family | 8.4 | 5.2 | 6.7 | 2.8 | −6.3 | 6.3 | 0.38 | 0.52 | 0.22 | −0.51 | 0.47 |
| 24 | Multifamily | 2.0 | 12.2 | −4.4 | −2.0 | 4.3 | 4.2 | 0.21 | −0.09 | −0.04 | 0.08 | 0.08 |
| 25 | Other structures | 13.6 | 6.6 | 3.6 | −2.6 | 1.9 | 7.5 | 0.76 | 0.44 | −0.33 | 0.23 | 0.92 |
| 26 | Equipment | 0.4 | 8.1 | 6.6 | 1.4 | 0.8 | 6.6 | 0.03 | 0.02 | 0.01 | 0.00 | 0.02 |
| Revisions (percentage points) | ||||||||||||
| 27 | Private fixed investment | 0.0 | 0.3 | 0.3 | −0.4 | 1.3 | −0.9 | 0.3 | 0.3 | −0.4 | 1.3 | −0.9 |
| 28 | Nonresidential | −0.2 | 0.4 | 0.4 | −0.5 | 1.4 | −1.3 | 0.30 | 0.25 | −0.38 | 1.13 | −1.03 |
| 29 | Structures | 0.3 | 0.1 | 0.0 | 0.3 | 2.6 | −1.5 | 0.02 | 0.01 | 0.05 | 0.48 | −0.31 |
| 30 | Equipment | −1.6 | −0.1 | −0.4 | −1.6 | 1.2 | −3.3 | −0.01 | −0.14 | −0.55 | 0.40 | −1.03 |
| 31 | Intellectual property products | 1.2 | 1.2 | 1.5 | 0.3 | 0.8 | 1.1 | 0.30 | 0.38 | 0.11 | 0.26 | 0.31 |
| 32 | Residential | 0.2 | 0.0 | 0.0 | 0.0 | 0.8 | 0.7 | 0.00 | 0.01 | 0.01 | 0.19 | 0.13 |
| 33 | Structures | 0.2 | 0.0 | 0.1 | 0.0 | 0.9 | 0.7 | 0.00 | 0.00 | 0.00 | 0.18 | 0.14 |
| 34 | Equipment | 0.0 | −0.5 | −0.4 | 0.2 | −0.4 | 0.2 | 0.00 | −0.01 | 0.01 | 0.00 | 0.00 |
- The estimates under the contribution columns are also percent changes.
Note. Percent changes are from NIPA table 5.3.1, contributions are from NIPA table 5.3.2, and shares are calculated from NIPA table 5.3.5.
The revisions reversed the direction of change in 2 of the 21 quarters in the recent revision period, but the quarterly pattern of real private fixed investment was otherwise similar to the previously published estimates, as illustrated in chart 4. The largest upward revision to real private fixed investment was for the second quarter of 2019, and the largest downward revision was for the third quarter of 2020.
[Click chart to expand]
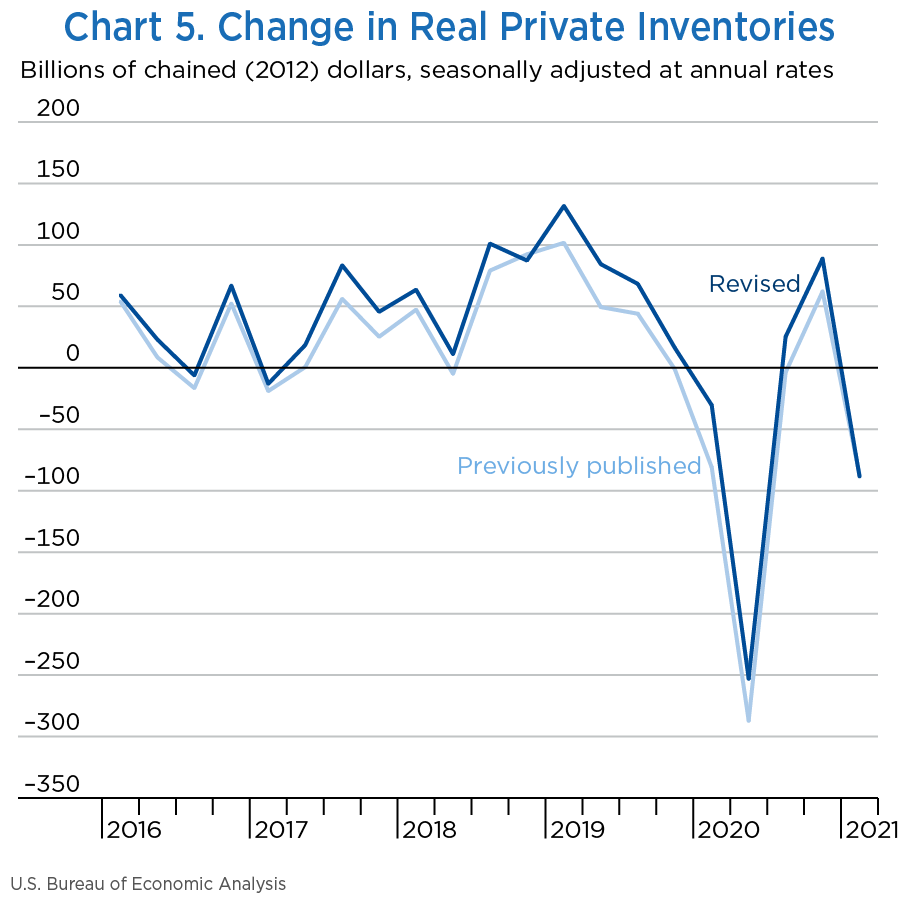
Revisions to inventory investment reflect Census Bureau data on inventory book values from a number of surveys, including revised and newly available data from its ASM, ARTS, and AWTS, and from revised monthly survey data, including the Manufacturers' Shipments, Inventories, and Orders Survey, the MRTS, and the Monthly Wholesale Trade Survey. Revisions also reflect newly available and revised IRS Statistics of Income data and revised data from the Department of Agriculture for farm inventories.
Change in real private inventories, or real inventory investment, was revised up $11.2 billion for 2016, revised up $17.8 billion for 2017, revised up $12.3 billion for 2018, revised up $26.6 billion for 2019, and revised up $35.2 billion for 2020 (table 5; additionally, chart 5 shows quarterly changes over the recent revision period).
- For 2016 and 2017, there were upward revisions to wholesale trade, to manufacturing, and to retail trade; for 2017, there were also upward revisions to other industries and to mining, utilities, and construction.
- For 2018, upward revisions to manufacturing, to other industries, and to mining, utilities, and construction were partly offset by downward revisions to farm, to retail trade, and to wholesale trade.
- For 2019, upward revisions to manufacturing, to mining, utilities, and construction, and to wholesale trade were partly offset by downward revisions to other industries, to retail trade, and to farm.
- For 2020, upward revisions to other industries, to retail trade, to wholesale trade, and to mining, utilities, and construction were partly offset by downward revisions to farm and to manufacturing.
| Line | Series | Level | Change from preceding period | ||||||||
|---|---|---|---|---|---|---|---|---|---|---|---|
| 2016 | 2017 | 2018 | 2019 | 2020 | 2016 | 2017 | 2018 | 2019 | 2020 | ||
| 1 | Change in private inventories1 | 35.7 | 33.6 | 65.7 | 75.1 | −42.3 | −101.9 | −2.1 | 32.1 | 9.4 | −117.4 |
| 2 | Farm | −6.7 | −6.4 | −9.1 | −17.2 | −7.7 | −7.8 | 0.3 | −2.7 | −8.1 | 9.5 |
| 3 | Mining, utilities, and construction | 8.2 | −14.9 | −11.1 | 14.0 | −4.2 | −11.9 | −23.1 | 3.9 | 25.0 | −18.1 |
| 4 | Manufacturing | 1.9 | 5.1 | 18.6 | 46.9 | −9.7 | −36.5 | 3.2 | 13.4 | 28.4 | −56.6 |
| 5 | Durable-goods industries | −14.3 | −1.1 | 12.3 | 26.3 | −5.7 | −32.7 | 13.2 | 13.4 | 14.0 | −32.0 |
| 6 | Nondurable-goods industries | 18.7 | 6.8 | 6.0 | 20.7 | −3.9 | −1.6 | −11.9 | −0.8 | 14.7 | −24.6 |
| 7 | Wholesale trade | 14.8 | 28.5 | 33.0 | 21.4 | −14.2 | −24.5 | 13.7 | 4.5 | −11.7 | −35.5 |
| 8 | Durable-goods industries | 3.7 | 19.4 | 33.0 | 12.1 | −25.5 | −5.9 | 15.7 | 13.6 | −20.8 | −37.6 |
| 9 | Nondurable-goods industries | 11.4 | 9.0 | −0.4 | 9.2 | 11.8 | −19.0 | −2.4 | −9.4 | 9.6 | 2.6 |
| 10 | Retail trade | 24.6 | 16.8 | 25.2 | 10.7 | −18.5 | −5.1 | −7.8 | 8.4 | −14.5 | −29.2 |
| 11 | Motor vehicle and parts dealers | 17.8 | 12.1 | 19.2 | 6.5 | −22.5 | 7.8 | −5.6 | 7.1 | −12.7 | −29.0 |
| 12 | Food and beverage stores | 1.6 | 2.0 | 1.6 | 0.4 | 1.1 | −0.5 | 0.4 | −0.4 | −1.2 | 0.7 |
| 13 | General merchandise stores | −0.8 | −3.1 | 1.9 | −1.8 | 2.7 | −3.6 | −2.3 | 5.0 | −3.7 | 4.4 |
| 14 | Other retail stores | 6.4 | 6.0 | 3.0 | 5.8 | −0.9 | −8.6 | −0.3 | −3.1 | 2.8 | −6.6 |
| 15 | Other industries | −8.5 | 2.0 | 5.9 | −1.6 | 10.1 | −17.9 | 10.5 | 3.9 | −7.5 | 11.7 |
| 16 | Residual2 | −1.7 | 1.9 | 3.5 | 0.7 | 2.4 | 0.0 | 3.5 | 1.7 | −2.8 | 1.6 |
| Revisions (percentage points) | |||||||||||
| 17 | Change in private inventories | 11.2 | 17.8 | 12.3 | 26.6 | 35.2 | 11.2 | 6.7 | −5.5 | 14.3 | 8.6 |
| 18 | Farm | 0.0 | 0.0 | −1.3 | −0.3 | −6.5 | 0.0 | 0.0 | −1.3 | 1.0 | −6.2 |
| 19 | Mining, utilities, and construction | 0.0 | 0.2 | 0.7 | 6.8 | 0.5 | 0.0 | 0.3 | 0.5 | 6.1 | −6.3 |
| 20 | Manufacturing | 2.8 | 5.6 | 9.2 | 26.2 | −0.1 | 2.8 | 2.8 | 3.6 | 17.0 | −26.3 |
| 21 | Wholesale trade | 7.7 | 8.3 | −0.6 | 6.4 | 11.3 | 7.7 | 0.5 | −8.8 | 6.9 | 4.9 |
| 22 | Retail trade | 0.8 | 3.4 | −0.8 | −3.7 | 13.1 | 0.8 | 2.6 | −4.2 | −3.0 | 16.8 |
| 23 | Other industries | −0.1 | 0.3 | 4.4 | −6.8 | 13.5 | −0.1 | 0.4 | 4.1 | −11.2 | 20.3 |
- Levels are from NIPA Table 5.7.5B.
- The residual is the difference between the first line and the sum of the most detailed lines.
Note. The chained-dollar series are calculated as the period-to-period change in end-of-period inventories. Because the formula for the chain-type quantity indexes uses weights of more than one period, chained-dollar estimates are usually not additive.
[Click chart to expand]
The revisions to exports reflect the incorporation of revised data from the ITAs and the extension of previous improvements to prior periods, including the recording of both imports and exports of services furnished without payment by financial intermediaries and the reclassification of several categories of imports and exports. As with the NIPAs, the ITAs are updated each year; the most recent update was released in June 2021.7
The percent change in real exports was revised up 0.1 percentage point for 2016, up 0.2 percentage point for 2017, and down 0.2 percentage point for 2018. It was unrevised for 2019, and it was revised down 0.7 percentage point for 2020 (table 6).
- For 2016, the revision was due to upward revisions to both goods and services. The revision to goods was due to an upward revision to “other” goods. The revision to services was primarily due to an upward revision to “other” services that was partly offset by a downward revision to other business services.
- For 2017, the revision was due to an upward revision to services, particularly travel services; a smaller upward revision to goods also contributed.
- For 2018, the revision was due to a downward revision to services that was partly offset by an upward revision to goods. The revision to services was primarily due to a downward revision to charges for the use of intellectual property n.e.c. (not elsewhere classified); downward revisions to “other” services, to other business services, and to transport services also contributed.
- For 2019, the revision was due to upward revisions to both goods and services. The revision to goods was primarily due to upward revisions to capital goods, except automotive. The revision to services was primarily due to upward revisions to charges for the use of intellectual property n.e.c. and to travel that were partly offset by a downward revision to other business services.
- For 2020, the revision was due to downward revisions to both goods and to services. The revision to goods was primarily due to a downward revision to industrial supplies and materials. Within services, downward revisions to travel services, to government goods and services n.e.c., and to charges for the use of intellectual property n.e.c. were partly offset by upward revisions to other business services, to other services, and to transport.
| Line | Series | Share of current-dollar exports (percent) | Change from preceding period (percent) | Contribution to percent change in real exports (percentage points) | ||||||||
|---|---|---|---|---|---|---|---|---|---|---|---|---|
| 2020 | 2016 | 2017 | 2018 | 2019 | 2020 | 2016 | 2017 | 2018 | 2019 | 2020 | ||
| 1 | Exports of goods and services1 | 100.0 | 0.4 | 4.1 | 2.8 | −0.1 | −13.6 | 0.4 | 4.1 | 2.8 | −0.1 | −13.6 |
| 2 | Exports of goods | 66.7 | 0.6 | 4.1 | 4.2 | −0.1 | −10.2 | 0.41 | 2.68 | 2.73 | −0.04 | −6.57 |
| 3 | Foods, feeds, and beverages | 6.6 | 5.9 | 0.4 | −0.1 | −1.3 | 4.9 | 0.33 | 0.02 | −0.01 | −0.07 | 0.26 |
| 4 | Industrial supplies and materials | 21.2 | 1.8 | 8.7 | 6.7 | 3.5 | −2.9 | 0.32 | 1.55 | 1.32 | 0.72 | −0.57 |
| 5 | Capital goods, except automotive | 21.7 | −2.1 | 2.5 | 4.7 | −3.1 | −16.2 | −0.49 | 0.58 | 1.03 | −0.69 | −3.57 |
| 6 | Automotive vehicles, engines, and parts | 6.0 | −0.2 | 4.7 | −0.2 | 2.1 | −21.2 | −0.01 | 0.31 | −0.01 | 0.13 | −1.39 |
| 7 | Consumer goods, except food and automotive | 8.2 | 0.2 | 3.4 | 3.2 | −0.6 | −15.3 | 0.01 | 0.29 | 0.26 | −0.05 | −1.27 |
| 8 | Other | 3.0 | 9.7 | −2.7 | 4.7 | −2.9 | −1.8 | 0.26 | −0.08 | 0.13 | −0.08 | −0.05 |
| 9 | Exports of services | 33.3 | 0.0 | 4.0 | 0.2 | −0.1 | −19.8 | −0.01 | 1.40 | 0.08 | −0.02 | −6.99 |
| 10 | Transport | 2.7 | −0.1 | 3.8 | 6.6 | −2.2 | −36.8 | 0.00 | 0.14 | 0.24 | −0.08 | −1.33 |
| 11 | Travel (for all purposes including education) | 3.4 | −0.6 | −0.1 | −0.1 | −2.5 | −63.3 | −0.05 | 0.00 | −0.01 | −0.20 | −5.04 |
| 12 | Charges for the use of intellectual property n.e.c. | 5.4 | 0.9 | 2.6 | −5.0 | −0.9 | −2.8 | 0.04 | 0.13 | −0.25 | −0.04 | −0.13 |
| 13 | Other business services | 20.8 | 0.4 | 6.6 | 0.4 | 1.9 | −2.3 | 0.06 | 1.12 | 0.07 | 0.33 | −0.41 |
| 14 | Government goods and services n.e.c. | 1.0 | −6.6 | 5.0 | 8.4 | −0.1 | −5.1 | −0.06 | 0.04 | 0.07 | 0.00 | −0.05 |
| 15 | Other | 0.1 | −1.3 | −12.6 | −24.1 | −23.8 | −26.5 | 0.00 | −0.03 | −0.04 | −0.03 | −0.03 |
| Revisions (percentage points) | ||||||||||||
| 16 | Exports of goods and services | 0.0 | 0.1 | 0.2 | −0.2 | 0.0 | −0.7 | 0.1 | 0.2 | −0.2 | 0.0 | −0.7 |
| 17 | Exports of goods | 0.0 | 0.1 | 0.0 | 0.0 | 0.0 | −0.7 | 0.06 | 0.05 | 0.01 | 0.03 | −0.47 |
| 18 | Exports of services | 0.0 | 0.2 | 0.3 | −0.6 | 0.0 | −0.6 | 0.05 | 0.12 | −0.19 | 0.03 | −0.14 |
- n.e.c.
- Not elsewhere classified
- The estimates under the contribution columns are also percent changes.
Note. Percent changes are from NIPA table 4.2.1, contributions are from NIPA table 4.2.2, and shares are calculated from NIPA table 4.2.5.
The direction of change in real exports was reversed for 1 of the 21 quarters in the recent revision period, but the quarterly pattern is similar to the previously published estimates, as illustrated in chart 6. The largest upward revision was to the second quarter of 2020; the largest downward revision was to the first quarter of 2020.

[Click chart to expand]
As with exports, the revisions to imports primarily reflect updated data from the ITAs and the extension of previous improvements to prior periods. The percent change in real imports was revised down 0.2 percentage point for 2016, down 0.3 percentage point for 2017, and was unrevised for 2018. It was revised up 0.1 percentage point for 2019 and up 0.4 percentage point for 2020 (table 7).
- For 2016, the revision was due to a downward revision to imports of goods that was partly offset by an upward revision to imports of services. The revision to goods was primarily due to downward revisions to “other” goods and to industrial supplies and materials.
- For 2017, the revision was primarily due to a downward revision to goods; a smaller downward revision to services also contributed. The revision to goods was primarily due to a downward revision to “other” goods.
- For 2018, an upward revision to imports of goods, particularly “other” goods, was offset by downward revisions to imports of services, particularly “other business services” and “other” services.
- For 2019, the revision was due to upward revisions to imports of goods and services to several categories; the largest upward revision was to industrial supplies and materials. The upward revisions were partly offset by downward revisions to several categories, particularly transport.
- For 2020, the revision was due to upward revisions to imports of goods across several categories, particularly consumer goods, except food and automotive.
| Line | Series | Share of current-dollar imports (percent) | Change from preceding period (percent) | Contribution to percent change in real imports (percentage points) | ||||||||
|---|---|---|---|---|---|---|---|---|---|---|---|---|
| 2020 | 2016 | 2017 | 2018 | 2019 | 2020 | 2016 | 2017 | 2018 | 2019 | 2020 | ||
| 1 | Imports of goods and services1 | 100.0 | 1.5 | 4.4 | 4.1 | 1.2 | −8.9 | 1.5 | 4.4 | 4.1 | 1.2 | −8.9 |
| 2 | Imports of goods | 83.2 | 1.1 | 4.5 | 5.1 | 0.5 | −5.6 | 0.90 | 3.62 | 4.11 | 0.43 | −4.54 |
| 3 | Foods, feeds, and beverages | 5.6 | 1.5 | 2.3 | 7.7 | 2.7 | 3.3 | 0.07 | 0.11 | 0.36 | 0.13 | 0.16 |
| 4 | Industrial supplies and materials | 15.3 | 2.5 | 1.4 | 0.2 | −5.1 | −8.2 | 0.41 | 0.24 | 0.04 | −0.93 | −1.31 |
| 5 | Capital goods, except automotive | 23.4 | 1.0 | 9.4 | 8.3 | −0.6 | −3.8 | 0.21 | 2.00 | 1.79 | −0.13 | −0.84 |
| 6 | Automotive vehicles, engines, and parts | 11.2 | 1.0 | 2.8 | 3.6 | 1.8 | −17.8 | 0.13 | 0.35 | 0.43 | 0.21 | −2.18 |
| 7 | Consumer goods, except food and automotive | 23.1 | 0.2 | 4.5 | 7.6 | 3.4 | −0.4 | 0.04 | 0.95 | 1.54 | 0.70 | −0.08 |
| 8 | Other | 4.6 | 0.9 | −0.7 | −1.3 | 11.5 | −6.5 | 0.04 | −0.03 | −0.06 | 0.45 | −0.29 |
| 9 | Imports of services | 16.8 | 3.0 | 4.3 | 0.0 | 3.9 | −22.6 | 0.55 | 0.82 | −0.01 | 0.72 | −4.39 |
| 10 | Transport | 2.6 | −2.8 | 2.5 | 8.7 | 2.3 | −34.6 | −0.10 | 0.08 | 0.29 | 0.08 | −1.25 |
| 11 | Travel (for all purposes including education) | 1.3 | 8.6 | 6.7 | 5.3 | 5.3 | −73.1 | 0.32 | 0.27 | 0.21 | 0.21 | −3.16 |
| 12 | Charges for the use of intellectual property n.e.c. | 1.5 | 18.4 | 3.8 | −5.9 | −3.9 | 1.7 | 0.24 | 0.06 | −0.09 | −0.05 | 0.02 |
| 13 | Other business services | 10.3 | 1.3 | 5.0 | −4.3 | 5.1 | 0.9 | 0.12 | 0.45 | −0.39 | 0.43 | 0.08 |
| 14 | Government goods and services n.e.c. | 0.9 | −2.7 | −1.9 | −2.3 | 5.5 | −1.1 | −0.02 | −0.01 | −0.02 | 0.04 | −0.01 |
| 15 | Other | 0.2 | −0.8 | −9.0 | −2.2 | 1.5 | −30.6 | 0.00 | −0.02 | −0.01 | 0.00 | −0.07 |
| Revisions (percentage points) | ||||||||||||
| 16 | Imports of goods and services | 0.0 | −0.2 | −0.3 | 0.0 | 0.1 | 0.4 | −0.2 | −0.3 | 0.0 | 0.1 | 0.4 |
| 17 | Imports of goods | −0.1 | −0.3 | −0.2 | 0.1 | 0.0 | 0.4 | −0.21 | −0.19 | 0.09 | 0.04 | 0.35 |
| 18 | Imports of services | 0.1 | 0.1 | −0.2 | −0.4 | 0.2 | −0.1 | 0.01 | −0.02 | −0.09 | 0.04 | 0.00 |
- n.e.c.
- Not elsewhere classified
- The estimates under the contribution columns are also percent changes.
Note. Percent changes are from NIPA table 4.2.1, contributions are from NIPA table 4.2.2, and shares are calculated from NIPA table 4.2.5.
The direction of change in real imports was reversed for 4 of the 21 quarters in the recent revision period; in a fifth quarter, the previously published measure had turned down, but the revised measure showed no change. Nevertheless, the quarterly pattern was generally similar to the previously published estimates, as illustrated in chart 7. The largest upward revision was to the first quarter of 2018; the largest downward revision was to the third quarter of 2020.

[Click chart to expand]
The revisions to state and local government spending primarily reflect revised and newly available source data from Census Bureau surveys of government finances, which are used to estimate most components of spending by state and local governments, revised and newly available data from the Census Bureau's Annual Survey of Public Employment & Payroll, revised BLS QCEW data for 2016–2019 and new QCEW data for 2020, which are used to prepare estimates of government compensation, and new Department of Health and Human Services Medical Expenditure Panel Survey data for 2019–2020.
Revisions to federal government spending primarily reflect revised allocations of Office of Management and Budget (OMB) data from the federal budget for fiscal year (FY) 2018 and FY 2019, revised FY 2020 OMB budget data for 2019 and 2020, and newly available preliminary OMB budget data for FY 2021.
The percent change in real government spending was revised up 0.2 percentage point for 2016, down 0.4 percentage point for 2017 and 2018, down 0.1 percentage point for 2019, and up 1.4 percentage points for 2020 (table 8).
- For 2016, the revision was primarily due to an upward revision to state and local government consumption expenditures; an upward revision to investment spending also contributed. The revision was partly offset by a downward revision to federal government spending.
- For 2017, the revision was due to a downward revision to state and local government consumption spending that was partly offset by upward revisions to state and local government investment spending and to federal government investment spending.
- For 2018, the revision was due to downward revisions to state and local government consumption and investment spending that were partly offset by an upward revision to federal government nondefense investment spending.
- For 2019, the revision was due to downward revisions to federal government nondefense and defense investment spending that were partly offset by federal government nondefense and defense consumption expenditures.
- For 2020, the revision was primarily due to an upward revision to state and local government consumption expenditures; an upward revision to federal government nondefense consumption expenditures also contributed, while federal defense consumption expenditures were a partial offset.
| Line | Series | Share of current-dollar CEGI (percent) | Change from preceding period (percent) | Contribution to percent change in real CEGI (percentage points) | ||||||||
|---|---|---|---|---|---|---|---|---|---|---|---|---|
| 2020 | 2016 | 2017 | 2018 | 2019 | 2020 | 2016 | 2017 | 2018 | 2019 | 2020 | ||
| 1 | Government consumption expenditures and gross investment1 | 100.0 | 2.0 | 0.5 | 1.4 | 2.2 | 2.5 | 2.0 | 0.5 | 1.4 | 2.2 | 2.5 |
| 2 | Consumption expenditures | 79.8 | 1.9 | 0.0 | 1.2 | 2.0 | 2.0 | 1.50 | 0.01 | 0.94 | 1.63 | 1.62 |
| 3 | Gross investment | 20.2 | 2.4 | 2.6 | 2.2 | 2.9 | 4.2 | 0.45 | 0.51 | 0.44 | 0.57 | 0.84 |
| 4 | Federal | 38.9 | 0.5 | 0.3 | 3.0 | 3.8 | 5.0 | 0.19 | 0.13 | 1.13 | 1.41 | 1.89 |
| 5 | National defense | 22.8 | −0.6 | 0.9 | 3.4 | 5.2 | 2.9 | −0.13 | 0.20 | 0.74 | 1.16 | 0.66 |
| 6 | Consumption expenditures | 18.1 | −0.1 | 0.3 | 2.8 | 4.9 | 1.9 | −0.01 | 0.06 | 0.50 | 0.88 | 0.34 |
| 7 | Gross investment | 4.7 | −2.6 | 3.4 | 5.6 | 6.5 | 6.9 | −0.11 | 0.14 | 0.24 | 0.28 | 0.31 |
| 8 | Nondefense | 16.1 | 2.1 | −0.5 | 2.5 | 1.6 | 8.1 | 0.32 | −0.07 | 0.39 | 0.25 | 1.23 |
| 9 | Consumption expenditures | 11.9 | 1.2 | −1.6 | 1.9 | 1.4 | 9.5 | 0.13 | −0.18 | 0.21 | 0.16 | 1.06 |
| 10 | Gross investment | 4.1 | 4.8 | 2.9 | 4.4 | 2.3 | 4.3 | 0.18 | 0.11 | 0.17 | 0.09 | 0.17 |
| 11 | State and local | 61.1 | 2.8 | 0.6 | 0.4 | 1.3 | 0.9 | 1.77 | 0.39 | 0.25 | 0.79 | 0.57 |
| 12 | Consumption expenditures | 49.7 | 2.7 | 0.3 | 0.4 | 1.2 | 0.4 | 1.38 | 0.13 | 0.23 | 0.59 | 0.22 |
| 13 | Gross investment | 11.4 | 3.5 | 2.3 | 0.2 | 1.8 | 3.1 | 0.39 | 0.26 | 0.03 | 0.20 | 0.35 |
| Revisions (percentage points) | ||||||||||||
| 14 | Government consumption expenditures and gross investment | 0.0 | 0.2 | −0.4 | −0.4 | −0.1 | 1.4 | 0.2 | −0.4 | −0.4 | −0.1 | 1.4 |
| 15 | Federal | 0.2 | −0.1 | 0.0 | 0.2 | −0.2 | 0.7 | −0.03 | 0.02 | 0.08 | −0.09 | 0.26 |
| 16 | National defense | −0.3 | −0.1 | 0.1 | 0.1 | −0.4 | −0.6 | −0.02 | 0.02 | 0.02 | −0.07 | −0.14 |
| 17 | Nondefense | 0.5 | −0.1 | 0.0 | 0.4 | −0.2 | 2.5 | −0.01 | 0.00 | 0.07 | −0.02 | 0.40 |
| 18 | State and local | −0.2 | 0.2 | −0.6 | −0.8 | 0.0 | 1.7 | 0.17 | −0.39 | −0.52 | 0.00 | 1.08 |
- The estimates under the contribution columns are also percent changes.
Note. Percent changes are from NIPA table 3.9.1, contributions are from NIPA table 3.9.2, and shares are calculated from NIPA table 3.9.5.
The direction of change in real government expenditures was reversed for only 1 of the 21 quarters in the recent revision period; in an additional quarter, the previously published measure showed no change, but the revised measure turned down. The quarterly pattern was similar to the previously published estimates, as illustrated in chart 8. The largest upward revision was to the third quarter of 2020; the largest downward revisions were to the third quarter of 2018 and the first quarter of 2021.

[Click chart to expand]
Revisions to BEA's various price measures—such as gross domestic purchases, GDP, and PCE—were small and reflect revised and newly available source data and the regular incorporation of annual weights for the most recent year (2020) (table 9). For the period 2015–2020, the average rate of increase in gross domestic purchases prices was 1.5 percent, the same as previously published.
- The percent change in the gross domestic purchases price index—a measure of the prices paid by consumers, businesses, and governments—was unrevised for 2016–2018, revised down by 0.1 percentage point for 2019, and unrevised for 2020.
- The percent change in GDP prices was unrevised for 2016–2019 and was revised up by 0.1 percentage point for 2020.
- The percent change in PCE prices was unrevised for 2016–2020.
- From the fourth quarter of 2015 to the first quarter of 2021, the average annual rate of increase in the price index for PCE was unrevised at 1.7 percent. The average annual rate of increase in the “core” PCE price index (which excludes food and energy) was revised up 0.1 percentage point to 1.8 percent.
| Line | Series | Change from preceding period (percent) | Contribution to percent change in prices (percentage points) | ||||||||
|---|---|---|---|---|---|---|---|---|---|---|---|
| 2016 | 2017 | 2018 | 2019 | 2020 | 2016 | 2017 | 2018 | 2019 | 2020 | ||
| 1 | Gross domestic purchases1 | 0.7 | 1.9 | 2.3 | 1.5 | 1.2 | 0.7 | 1.9 | 2.3 | 1.5 | 1.2 |
| 2 | Personal consumption expenditures (PCE) | 1.0 | 1.8 | 2.1 | 1.5 | 1.2 | 0.66 | 1.21 | 1.41 | 0.97 | 0.78 |
| 3 | Goods | −1.6 | 0.3 | 0.7 | −0.5 | −0.7 | −0.34 | 0.06 | 0.15 | −0.10 | −0.15 |
| 4 | Durable goods | −2.4 | −2.3 | −1.7 | −1.2 | −0.8 | −0.17 | −0.16 | −0.12 | −0.08 | −0.06 |
| 5 | Nondurable goods | −1.3 | 1.6 | 1.9 | −0.1 | −0.7 | −0.18 | 0.23 | 0.27 | −0.01 | −0.09 |
| 6 | Services | 2.2 | 2.5 | 2.8 | 2.4 | 2.1 | 1.00 | 1.15 | 1.27 | 1.07 | 0.92 |
| 7 | Gross private domestic investment | 0.0 | 1.7 | 1.9 | 1.6 | 1.2 | 0.00 | 0.28 | 0.32 | 0.28 | 0.21 |
| 8 | Fixed investment | 0.1 | 1.7 | 1.9 | 1.6 | 1.2 | 0.02 | 0.28 | 0.32 | 0.28 | 0.21 |
| 9 | Nonresidential | −0.8 | 0.8 | 0.8 | 1.3 | 0.6 | −0.10 | 0.11 | 0.11 | 0.17 | 0.09 |
| 10 | Structures | 0.2 | 2.6 | 1.6 | 4.1 | 1.5 | 0.01 | 0.08 | 0.05 | 0.12 | 0.04 |
| 11 | Equipment | −1.1 | −0.1 | 0.1 | 0.1 | −0.4 | −0.06 | 0.00 | 0.01 | 0.01 | −0.02 |
| 12 | Intellectual property products | −1.1 | 0.8 | 1.1 | 0.9 | 1.4 | −0.04 | 0.04 | 0.05 | 0.04 | 0.07 |
| 13 | Residential | 3.5 | 4.5 | 5.6 | 2.9 | 3.3 | 0.12 | 0.17 | 0.21 | 0.11 | 0.13 |
| 14 | Change in private inventories | --- | --- | --- | --- | --- | −0.02 | 0.00 | 0.00 | 0.00 | −0.01 |
| 15 | Government consumption expenditures and gross investment | 0.2 | 2.4 | 3.7 | 1.7 | 1.4 | 0.04 | 0.40 | 0.62 | 0.29 | 0.25 |
| 16 | Federal | 0.5 | 1.9 | 2.9 | 1.8 | 1.1 | 0.03 | 0.12 | 0.18 | 0.12 | 0.07 |
| 17 | National defense | 0.3 | 1.6 | 2.7 | 1.6 | 1.1 | 0.01 | 0.06 | 0.10 | 0.06 | 0.04 |
| 18 | Nondefense | 0.9 | 2.4 | 3.2 | 2.2 | 1.2 | 0.02 | 0.06 | 0.08 | 0.06 | 0.03 |
| 19 | State and local | 0.1 | 2.6 | 4.1 | 1.7 | 1.6 | 0.01 | 0.28 | 0.43 | 0.17 | 0.17 |
| Addenda | |||||||||||
| 20 | Gross domestic purchases: | ||||||||||
| 21 | Food | −1.1 | −0.1 | 0.5 | 1.0 | 3.4 | −0.06 | −0.01 | 0.02 | 0.05 | 0.17 |
| 22 | Energy goods and services | −7.5 | 8.7 | 8.1 | −2.2 | −8.7 | −0.22 | 0.22 | 0.21 | −0.06 | −0.23 |
| 23 | Excluding food and energy | 1.1 | 1.8 | 2.3 | 1.7 | 1.4 | 0.98 | 1.68 | 2.11 | 1.56 | 1.29 |
| 24 | Personal consumption expenditures: | ||||||||||
| 25 | Food and beverages purchased for off-premises consumption | −1.0 | −0.1 | 0.5 | 1.0 | 3.4 | --- | --- | --- | --- | --- |
| 26 | Energy goods and services | −7.3 | 8.7 | 8.0 | −2.1 | −8.5 | --- | --- | --- | --- | --- |
| 27 | Excluding food and energy | 1.6 | 1.7 | 2.0 | 1.7 | 1.4 | --- | --- | --- | --- | --- |
| 28 | Gross domestic product (GDP) | 1.0 | 1.9 | 2.4 | 1.8 | 1.3 | --- | --- | --- | --- | --- |
| 29 | Exports of goods and services | −2.0 | 2.6 | 3.4 | −0.5 | −2.5 | --- | --- | --- | --- | --- |
| 30 | Imports of goods and services | −3.4 | 2.2 | 2.8 | −1.6 | −2.2 | --- | --- | --- | --- | --- |
| Revisions (percentage points) | |||||||||||
| 31 | Gross domestic purchases | 0.0 | 0.0 | 0.0 | −0.1 | 0.0 | 0.0 | 0.0 | 0.0 | 0.0 | 0.1 |
| 32 | Food | 0.0 | 0.0 | 0.0 | 0.0 | −0.1 | 0.00 | 0.00 | 0.00 | 0.00 | −0.01 |
| 33 | Energy goods and services | 0.0 | 0.0 | 0.1 | 0.0 | −0.9 | 0.00 | 0.00 | 0.00 | 0.00 | −0.03 |
| 34 | Excluding food and energy | 0.0 | 0.0 | 0.0 | 0.0 | 0.1 | −0.04 | 0.03 | 0.00 | −0.04 | 0.11 |
| 35 | PCE | 0.0 | 0.0 | 0.0 | 0.0 | 0.0 | --- | --- | --- | --- | --- |
| 36 | Food and beverages purchased for off-premises consumption | 0.0 | 0.0 | 0.0 | 0.0 | 0.0 | --- | --- | --- | --- | --- |
| 37 | Energy goods and services | 0.0 | 0.0 | 0.0 | 0.0 | −0.1 | --- | --- | --- | --- | --- |
| 38 | Excluding food and energy | 0.0 | 0.0 | 0.0 | 0.0 | 0.0 | --- | --- | --- | --- | --- |
| 39 | GDP | 0.0 | 0.0 | 0.0 | 0.0 | 0.1 | --- | --- | --- | --- | --- |
| 40 | Exports of goods and services | 0.0 | 0.0 | 0.0 | −0.1 | 0.5 | --- | --- | --- | --- | --- |
| 41 | Imports of goods and services | 0.1 | 0.0 | −0.1 | −0.1 | 0.1 | --- | --- | --- | --- | --- |
- The estimates under the contribution columns are also percent changes.
Note. Most percent changes are from NIPA table 1.6.7; percent changes for PCE for food and energy goods and services and for PCE excluding food and energy are from NIPA table 2.3.7. Contributions are from NIPA table 1.6.8. GDP, export, and import prices are from NIPA table 1.1.7.
The revised estimates did not reverse the direction of change in the price indexes for gross domestic purchases and for gross domestic purchases excluding food and energy for the recent revision period, and the quarterly patterns are similar to the previously published estimates, as shown in chart 9.

[Click chart to expand]
Revisions to the components of national income reflect the incorporation of a variety of newly available and revised source data. For this annual update, major source data include IRS tabulations of tax return data for corporations, for sole proprietorships, and for partnerships; Census Bureau data on government finances; revised OMB federal budget data; FRB data from the Financial Accounts of the United States; revised BLS QCEW data; and revised data from BEA's ITAs. Additionally, the revisions to national income reflect the revisions to rental income of persons that result from the new estimating method and source data for the measures of housing services.
For measures of income and saving, the annual update extends back to the first quarter of 1999 to reflect the revised measures from the ITAs of income flows between the United States and the rest of the world. Revisions to national income prior to 2016 were small; the revision for 2015 was −0.2 percent of national income, and the largest revision prior to 2015 was 0.3 percent.
National income was revised down 0.3 percent for 2016, down 0.5 percent for 2017, and down 0.1 percent for 2018. It was revised up less than 0.1 percent for 2019, and up 0.6 percent for 2020. For this recent time period, the largest downward revisions were to rental income of persons due to the changed estimating method for housing services. The largest offsetting upward revisions were to corporate profits (table 10).
- For 2016, downward revisions, particularly to rental income of persons and to net interest, were partly offset by upward revisions to corporate profits, compensation of employees, and business current transfer payments.
- For 2017, downward revisions to rental income of persons and to net interest were partly offset by upward revisions to corporate profits, compensation of employees, and taxes on production and imports.
- For 2018, downward revisions to rental income of persons and to net interest were partly offset by upward revisions to corporate profits, taxes on production and imports, and compensation of employees.
- For 2019, upward revisions to corporate profits, taxes on production and imports, and compensation of employees were partly offset by downward revisions to rental income of persons, proprietors' income, and net interest.
- For 2020, upward revisions to corporate profits, compensation of employees, and taxes on production and imports were partly offset by downward revisions to rental income of persons and proprietors' income.
| Line | Series | Level | Change from preceding period | ||||||||
|---|---|---|---|---|---|---|---|---|---|---|---|
| 2016 | 2017 | 2018 | 2019 | 2020 | 2016 | 2017 | 2018 | 2019 | 2020 | ||
| 1 | National income | 16,033.4 | 16,774.9 | 17,673.3 | 18,273.1 | 17,710.7 | 283.9 | 741.5 | 898.4 | 599.7 | −562.3 |
| 2 | Compensation of employees | 9,966.1 | 10,426.1 | 10,959.5 | 11,447.7 | 11,572.2 | 266.7 | 460.0 | 533.4 | 488.2 | 124.4 |
| 3 | Wages and salaries | 8,091.2 | 8,474.7 | 8,900.5 | 9,323.5 | 9,444.1 | 231.8 | 383.4 | 425.8 | 423.0 | 120.6 |
| 4 | Government | 1,308.0 | 1,348.0 | 1,401.4 | 1,450.2 | 1,494.5 | 32.3 | 40.0 | 53.4 | 48.8 | 44.3 |
| 5 | Other | 6,783.2 | 7,126.7 | 7,499.1 | 7,873.3 | 7,949.6 | 199.5 | 343.5 | 372.4 | 374.2 | 76.3 |
| 6 | Supplements to wages and salaries | 1,874.9 | 1,951.5 | 2,059.0 | 2,124.2 | 2,128.0 | 34.9 | 76.6 | 107.6 | 65.2 | 3.9 |
| 7 | Employer contributions for employee pension and insurance funds | 1,293.9 | 1,346.5 | 1,434.3 | 1,474.6 | 1,464.4 | 23.3 | 52.6 | 87.8 | 40.3 | −10.2 |
| 8 | Employer contributions for government social insurance | 580.9 | 604.9 | 624.7 | 649.6 | 663.7 | 11.6 | 24.0 | 19.8 | 24.9 | 14.1 |
| 9 | Proprietors' income with IVA and CCAdj | 1,423.3 | 1,505.8 | 1,580.4 | 1,598.9 | 1,650.0 | 2.5 | 82.5 | 74.6 | 18.5 | 51.1 |
| 10 | Farm | 34.1 | 39.5 | 38.9 | 38.4 | 70.2 | −20.0 | 5.4 | −0.5 | −0.5 | 31.7 |
| 11 | Nonfarm | 1,389.2 | 1,466.4 | 1,541.5 | 1,560.5 | 1,579.9 | 22.5 | 77.2 | 75.1 | 19.0 | 19.4 |
| 12 | Rental income of persons with CCAdj | 626.6 | 652.7 | 681.9 | 692.1 | 711.6 | 17.2 | 26.1 | 29.2 | 10.2 | 19.5 |
| 13 | Corporate profits with IVA and CCAdj | 2,037.7 | 2,128.9 | 2,305.0 | 2,367.8 | 2,243.8 | −22.8 | 91.2 | 176.1 | 62.8 | −124.0 |
| 14 | Taxes on corporate income | 376.2 | 312.3 | 281.5 | 302.2 | 275.6 | −20.1 | −63.9 | −30.8 | 20.6 | −26.5 |
| 15 | Profits after tax with IVA and CCAdj | 1,661.5 | 1,816.6 | 2,023.4 | 2,065.6 | 1,968.1 | −2.7 | 155.0 | 206.8 | 42.2 | −97.5 |
| 16 | Net dividends | 1,189.4 | 1,264.1 | 1,338.4 | 1,386.4 | 1,394.9 | 24.5 | 74.7 | 74.3 | 48.0 | 8.5 |
| 17 | Undistributed profits with IVA and CCAdj | 472.1 | 552.5 | 685.0 | 679.2 | 573.3 | −27.2 | 80.3 | 132.6 | −5.8 | −105.9 |
| 18 | Net interest and miscellaneous payments | 567.3 | 612.5 | 598.7 | 558.2 | 618.8 | −23.8 | 45.2 | −13.8 | −40.5 | 60.6 |
| 19 | Taxes on production and imports | 1,311.6 | 1,366.3 | 1,461.7 | 1,532.3 | 1,534.7 | 36.5 | 54.7 | 95.4 | 70.6 | 2.3 |
| 20 | Less: Subsidies | 61.7 | 59.9 | 63.3 | 73.0 | 761.4 | 4.6 | −1.9 | 3.4 | 9.6 | 688.4 |
| 21 | Business current transfer payments (net) | 166.9 | 149.1 | 158.0 | 162.3 | 158.6 | 11.3 | −17.8 | 8.9 | 4.2 | −3.7 |
| 22 | To persons (net) | 59.7 | 48.7 | 50.2 | 56.0 | 59.9 | 9.5 | −11.0 | 1.5 | 5.7 | 3.9 |
| 23 | To government (net) | 105.3 | 99.7 | 103.8 | 95.7 | 97.8 | −5.2 | −5.6 | 4.1 | −8.0 | 2.1 |
| 24 | To the rest of the world (net) | 1.9 | 0.7 | 4.1 | 10.6 | 0.9 | 7.1 | −1.2 | 3.3 | 6.5 | −9.7 |
| 25 | Current surplus of government enterprises | −4.4 | −6.7 | −8.6 | −13.3 | −17.5 | 0.8 | −2.2 | −1.9 | −4.7 | −4.2 |
| Revisions | |||||||||||
| 26 | National income | −49.3 | −78.9 | −16.2 | 4.0 | 102.2 | −14.2 | −29.6 | 62.7 | 20.2 | 98.2 |
| 27 | Compensation of employees | 2.3 | 3.6 | 9.4 | 15.3 | 81.5 | 2.3 | 1.3 | 5.8 | 5.9 | 66.2 |
| 28 | Proprietors' income with IVA and CCAdj | −1.5 | −3.2 | −5.5 | −58.8 | −45.1 | 0.7 | −1.7 | −2.4 | −53.2 | 13.7 |
| 29 | Rental income of persons with CCAdj | −56.0 | −69.2 | −77.4 | −95.0 | −90.2 | −16.5 | −13.2 | −8.2 | −17.6 | 4.8 |
| 30 | Corporate profits with IVA and CCAdj | 14.0 | 14.4 | 62.0 | 117.3 | 123.5 | 14.0 | 0.4 | 47.6 | 55.3 | 6.2 |
| 31 | Net interest and miscellaneous payments | −10.0 | −23.9 | −20.4 | −15.2 | −0.3 | −15.3 | −13.9 | 3.5 | 5.2 | 14.9 |
| 32 | Taxes on production and imports | −0.1 | 2.3 | 17.0 | 40.9 | 53.0 | −0.1 | 2.5 | 14.6 | 24.0 | 12.1 |
| 33 | Less: Subsidies | 0.0 | 0.0 | 0.0 | −0.9 | 15.0 | 0.0 | 0.0 | 0.0 | −0.9 | 15.9 |
| 34 | Business current transfer payments (net) | 2.3 | −1.6 | 1.5 | 4.3 | −6.0 | 0.9 | −3.8 | 3.0 | 2.8 | −10.3 |
| 35 | Current surplus of government enterprises | −0.1 | −1.4 | −2.7 | −5.7 | 0.9 | −0.1 | −1.3 | −1.3 | −3.0 | 6.6 |
- CCADj
- Capital consumption adjustment
- IVA
- Inventory valuation adjustment
Note. Dollar levels are from NIPA table 1.12.
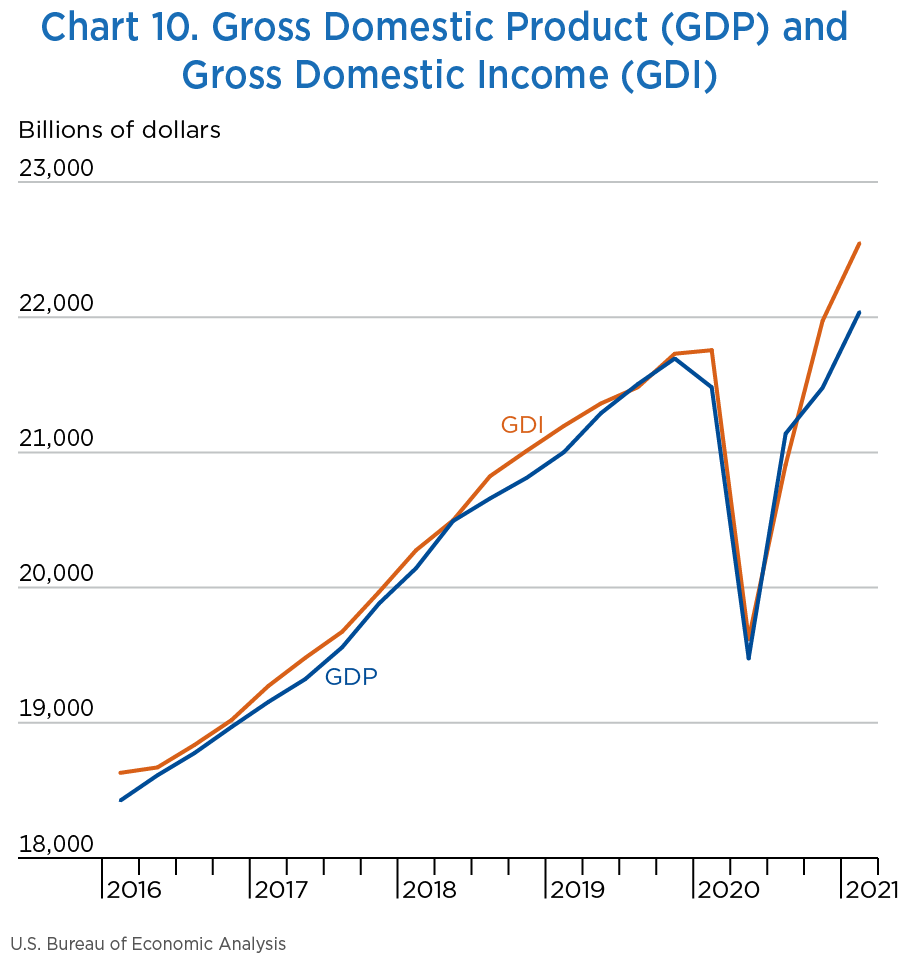
Current-dollar GDI was revised down by less than 0.3 percent for 2016, down by less than 0.4 percent for 2017, and down by less than 0.1 percent for 2018. It was revised up by 0.1 percent for 2019, and by less than 0.5 percent for 2020 (table 11 and chart 10).
The percent change in real GDI was unrevised for 2016, was revised down 0.1 percentage point for 2017, revised up 0.3 percentage point for 2018, revised up 0.2 percentage point for 2019, and revised up 0.4 percentage point for 2020. From 2015 to 2020, the average of real GDI and real GDP increased at an average annual rate of 1.1 percent, up 0.1 percentage point from the previously published estimates.
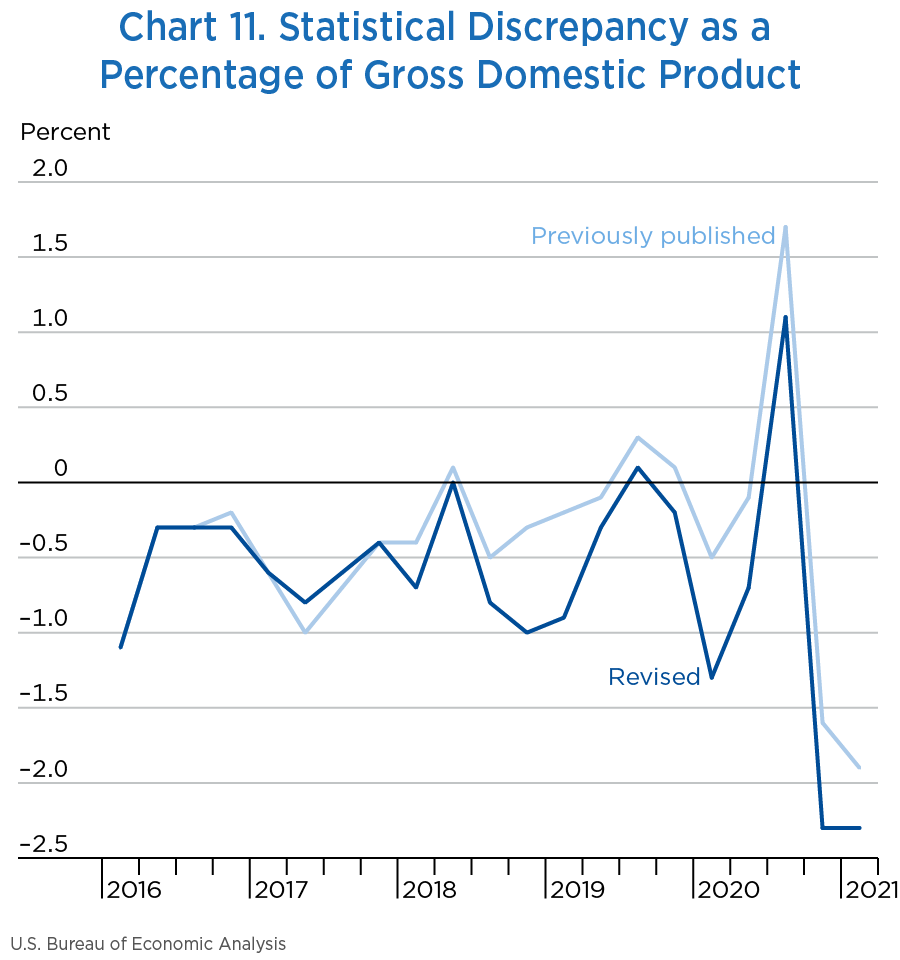
The statistical discrepancy—current-dollar GDP less current-dollar GDI as a percentage of GDP—was −0.5 percent for 2016, −0.6 percent for 2017 and 2018, −0.3 percent for 2019, and −0.8 percent for 2020. The discrepancy as a percentage of GDP was the same as previously published for the first quarter of 2016 to the first quarter of 2017; was revised up for the second and third quarters of 2017; was unrevised for the fourth quarter of 2017, and was revised down for the first quarter of 2018 to the first quarter of 2021, as shown in chart 11.
| Line | Series | Level | Change from preceding period | ||||||||
|---|---|---|---|---|---|---|---|---|---|---|---|
| 2016 | 2017 | 2018 | 2019 | 2020 | 2016 | 2017 | 2018 | 2019 | 2020 | ||
| 1 | Gross domestic product | 18,695.1 | 19,479.6 | 20,527.2 | 21,372.6 | 20,893.7 | 489.1 | 784.5 | 1,047.5 | 845.4 | −478.8 |
| 2 | Less: Statistical discrepancy | −93.4 | −118.9 | −125.5 | −69.7 | −170.6 | 141.1 | −25.5 | −6.6 | 55.8 | −100.9 |
| 3 | Equals: Gross domestic income | 18,788.5 | 19,598.5 | 20,652.6 | 21,442.2 | 21,064.3 | 348.0 | 810.0 | 1,054.1 | 789.6 | −377.9 |
| 4 | Plus: Income receipts from the rest of the world | 893.5 | 1,032.7 | 1,142.1 | 1,160.3 | 992.9 | 32.7 | 139.2 | 109.4 | 18.2 | −167.4 |
| 5 | Less: Income payments to the rest of the world | 661.5 | 738.2 | 847.9 | 893.9 | 770.6 | 21.2 | 76.6 | 109.8 | 46.0 | −123.3 |
| 6 | Equals: Gross national income | 19,020.5 | 19,893.1 | 20,946.8 | 21,708.7 | 21,286.6 | 359.6 | 872.6 | 1,053.7 | 761.9 | −422.0 |
| 7 | Less: Consumption of fixed capital | 2,987.1 | 3,118.2 | 3,273.4 | 3,435.6 | 3,575.9 | 75.7 | 131.1 | 155.3 | 162.1 | 140.3 |
| 8 | Equals: National income | 16,033.4 | 16,774.9 | 17,673.3 | 18,273.1 | 17,710.7 | 283.9 | 741.5 | 898.4 | 599.7 | −562.3 |
| 9 | Less: | ||||||||||
| 10 | Corporate profits with IVA and CCAdj | 2,037.7 | 2,128.9 | 2,305.0 | 2,367.8 | 2,243.8 | −22.8 | 91.2 | 176.1 | 62.8 | −124.0 |
| 11 | Taxes on production and imports less subsidies | 1,249.9 | 1,306.4 | 1,398.4 | 1,459.4 | 773.3 | 31.9 | 56.6 | 92.0 | 61.0 | −686.1 |
| 12 | Contributions for government social insurance, domestic | 1,238.8 | 1,298.8 | 1,360.5 | 1,421.4 | 1,459.5 | 34.1 | 59.9 | 61.7 | 61.0 | 38.0 |
| 13 | Net interest and miscellaneous payments on assets | 567.3 | 612.5 | 598.7 | 558.2 | 618.8 | −23.8 | 45.2 | −13.8 | −40.5 | 60.6 |
| 14 | Business current transfer payments (net) | 166.9 | 149.1 | 158.0 | 162.3 | 158.6 | 11.3 | −17.8 | 8.9 | 4.2 | −3.7 |
| 15 | Current surplus of government enterprises | −4.4 | −6.7 | −8.6 | −13.3 | −17.5 | 0.8 | −2.2 | −1.9 | −4.7 | −4.2 |
| 16 | Plus: Personal income receipts on assets | 2,542.6 | 2,707.9 | 2,868.3 | 2,968.0 | 2,912.1 | 67.8 | 165.3 | 160.4 | 99.7 | −55.9 |
| 17 | Plus: Personal current transfer receipts | 2,777.0 | 2,856.4 | 2,976.3 | 3,139.1 | 4,241.1 | 91.6 | 79.3 | 120.0 | 162.8 | 1,102.0 |
| 18 | Equals: Personal income | 16,096.9 | 16,850.2 | 17,706.0 | 18,424.4 | 19,627.6 | 411.7 | 753.3 | 855.8 | 718.4 | 1,203.2 |
| Revisions | |||||||||||
| 19 | Gross domestic product | −50.0 | −63.4 | −84.7 | −60.6 | −42.8 | −17.7 | −13.4 | −21.3 | 24.1 | 17.8 |
| 20 | Statistical discrepancy | −1.2 | 12.5 | −67.5 | −82.5 | −143.5 | −4.1 | 13.8 | −80.0 | −15.0 | −61.1 |
| 21 | Gross domestic income | −48.7 | −75.9 | −17.3 | 21.8 | 100.7 | −13.6 | −27.2 | 58.7 | 39.1 | 78.9 |
- CCADj
- Capital consumption adjustment
- IVA
- Inventory valuation adjustment
Note. Dollar levels are from NIPA table 1.7.5.
[Click chart to expand]
[Click chart to expand]
Most of the components of personal income are also components of national income and GDI, and the revisions reflect the incorporation of much of the same newly available and revised source data, including tabulations of tax return data from the IRS, FRB data from the Financial Accounts of the United States, and wage and salary data from the BLS QCEW. The revisions to personal income also reflect the revisions to rental income of persons that result from the new estimating method and source data for the measures of housing services.
The impacts on personal income of the government's response to the global COVID-19 pandemic are embedded in the source data underlying the measures; therefore, while the total impacts are reflected in personal income, the impacts of each recovery program can't be separately identified. However, the impacts of select programs are provided on BEA's website at “Federal Recovery Programs and BEA Statistics.” For more information, see the box “COVID 19 in the National Income and Product Accounts.”
Personal income was revised down for 2016–2020 (table 12).
- For 2016, the revision was primarily due to a downward revision to rental income of persons; personal interest income and proprietors' income were also revised down.
- For 2017, the revision was primarily due to downward revisions to rental income of persons and to personal interest income; personal dividend income and proprietors' income were also revised down.
- For 2018, the revision was primarily due to downward revisions to rental income of persons, personal dividend income, and personal interest income; proprietors' income was also revised down. The downward revisions were partly offset by upward revisions to compensation of employees and to personal current transfer receipts.
- For 2019, the revision was primarily due to downward revisions to rental income of persons, nonfarm proprietors' income, and personal interest income; farm proprietors' income was also revised down. These revisions were partly offset by upward revisions to personal dividend income, compensation of employees, and personal current transfer receipts.
- For 2020, the revision was primarily due to downward revisions to rental income of persons, nonfarm proprietors' income, personal current transfer receipts, and personal interest income; these were partly offset by upward revisions to compensation and personal dividend income.
- Personal saving was revised up for 2016, 2017, 2019, and 2020, as personal outlays, particularly personal consumption expenditures, were revised down by more than personal income. Revisions to personal taxes were small. Personal saving was revised down for 2018, as personal income was revised down by more than personal outlays.
- The personal saving rate (personal saving as a percentage of disposable personal income) was revised up to 7.0 percent in 2016, revised up to 7.3 percent in 2017, revised down to 7.6 percent in 2018, revised up to 7.6 percent in 2019, and revised up to 16.6 percent in 2020 (an upward revision of 0.2 percentage point).
- For the first quarter of 2016 through the first quarter of 2021, the personal saving rate was revised up for 12 quarters, revised down for 5 quarters, and was unrevised for 4 quarters. The average quarterly saving rate over this period was unrevised at 9.7 percent.
| Line | Series | Level | Change from preceding period | ||||||||
|---|---|---|---|---|---|---|---|---|---|---|---|
| 2016 | 2017 | 2018 | 2019 | 2020 | 2016 | 2017 | 2018 | 2019 | 2020 | ||
| 1 | Personal income | 16,096.9 | 16,850.2 | 17,706.0 | 18,424.4 | 19,627.6 | 411.7 | 753.3 | 855.8 | 718.4 | 1,203.2 |
| 2 | Compensation of employees | 9,966.1 | 10,426.1 | 10,959.5 | 11,447.7 | 11,572.2 | 266.7 | 460.0 | 533.4 | 488.2 | 124.4 |
| 3 | Wages and salaries | 8,091.2 | 8,474.7 | 8,900.5 | 9,323.5 | 9,444.1 | 231.8 | 383.4 | 425.8 | 423.0 | 120.6 |
| 4 | Private industries | 6,783.2 | 7,126.7 | 7,499.1 | 7,873.3 | 7,949.6 | 199.5 | 343.5 | 372.4 | 374.2 | 76.3 |
| 5 | Government | 1,308.0 | 1,348.0 | 1,401.4 | 1,450.2 | 1,494.5 | 32.3 | 40.0 | 53.4 | 48.8 | 44.3 |
| 6 | Supplements to wages and salaries | 1,874.9 | 1,951.5 | 2,059.0 | 2,124.2 | 2,128.0 | 34.9 | 76.6 | 107.6 | 65.2 | 3.9 |
| 7 | Proprietors' income with IVA and CCAdj | 1,423.3 | 1,505.8 | 1,580.4 | 1,598.9 | 1,650.0 | 2.5 | 82.5 | 74.6 | 18.5 | 51.1 |
| 8 | Farm | 34.1 | 39.5 | 38.9 | 38.4 | 70.2 | −20.0 | 5.4 | −0.5 | −0.5 | 31.7 |
| 9 | Nonfarm | 1,389.2 | 1,466.4 | 1,541.5 | 1,560.5 | 1,579.9 | 22.5 | 77.2 | 75.1 | 19.0 | 19.4 |
| 10 | Rental income of persons with CCAdj | 626.6 | 652.7 | 681.9 | 692.1 | 711.6 | 17.2 | 26.1 | 29.2 | 10.2 | 19.5 |
| 11 | Personal income receipts on assets | 2,542.6 | 2,707.9 | 2,868.3 | 2,968.0 | 2,912.1 | 67.8 | 165.3 | 160.4 | 99.7 | −55.9 |
| 12 | Personal interest income | 1,465.2 | 1,553.4 | 1,615.0 | 1,652.0 | 1,614.4 | 23.4 | 88.2 | 61.6 | 37.0 | −37.7 |
| 13 | Personal dividend income | 1,077.4 | 1,154.5 | 1,253.3 | 1,316.0 | 1,297.8 | 44.4 | 77.1 | 98.8 | 62.7 | −18.2 |
| 14 | Personal current transfer receipts | 2,777.0 | 2,856.4 | 2,976.3 | 3,139.1 | 4,241.1 | 91.6 | 79.3 | 120.0 | 162.8 | 1,102.0 |
| 15 | Government social benefits to persons | 2,717.3 | 2,807.6 | 2,926.1 | 3,083.1 | 4,181.3 | 82.1 | 90.3 | 118.5 | 157.0 | 1,098.1 |
| 16 | Other current transfer receipts, from business (net) | 59.7 | 48.7 | 50.2 | 56.0 | 59.9 | 9.5 | −11.0 | 1.5 | 5.7 | 3.9 |
| 17 | Less: Contributions for government social insurance | 1,238.8 | 1,298.8 | 1,360.5 | 1,421.4 | 1,459.5 | 34.1 | 59.9 | 61.7 | 61.0 | 38.0 |
| 18 | Less: Personal current taxes | 1,958.2 | 2,049.0 | 2,076.3 | 2,205.1 | 2,195.6 | 18.3 | 90.8 | 27.3 | 128.8 | −9.6 |
| 19 | Equals: Disposable personal income (DPI) | 14,138.7 | 14,801.2 | 15,629.7 | 16,219.3 | 17,432.0 | 393.4 | 662.5 | 828.5 | 589.6 | 1,212.8 |
| 20 | Less: Personal outlays | 13,150.8 | 13,724.8 | 14,438.8 | 14,981.5 | 14,544.5 | 440.4 | 574.0 | 714.0 | 542.7 | −437.0 |
| 21 | Equals: Personal saving | 987.8 | 1,076.4 | 1,190.9 | 1,237.8 | 2,887.5 | −47.0 | 88.6 | 114.5 | 46.8 | 1,649.7 |
| 22 | Personal saving as a percentage of DPI (percent) | 7.0 | 7.3 | 7.6 | 7.6 | 16.6 | −0.5 | 0.3 | 0.3 | 0.0 | 9.0 |
| Revisions | |||||||||||
| 23 | Personal income | −63.8 | −98.4 | −145.8 | −127.1 | −100.3 | −24.8 | −34.6 | −47.4 | 18.7 | 26.8 |
| 24 | Less: Personal current taxes | 0.3 | 2.3 | −9.0 | 2.2 | −7.1 | 0.3 | 1.9 | −11.3 | 11.3 | −9.4 |
| 25 | Equals: DPI | −64.2 | −100.7 | −136.8 | −129.4 | −93.2 | −25.1 | −36.5 | −36.2 | 7.5 | 36.1 |
| 26 | Less: Personal outlays | −77.0 | −106.1 | −90.5 | −135.9 | −103.7 | −41.8 | −29.2 | 15.6 | −45.5 | 32.2 |
| 27 | Equals: Personal saving | 12.8 | 5.4 | −46.4 | 6.6 | 10.5 | 16.6 | −7.4 | −51.8 | 52.9 | 3.9 |
| 28 | Personal saving as a percentage of DPI (percentage points) | 0.1 | 0.1 | −0.2 | 0.1 | 0.2 | 0.1 | 0.0 | −0.3 | 0.3 | 0.1 |
- CCADj
- Capital consumption adjustment
- IVA
- Inventory valuation adjustment
Note. Dollar levels are from NIPA table 2.1.
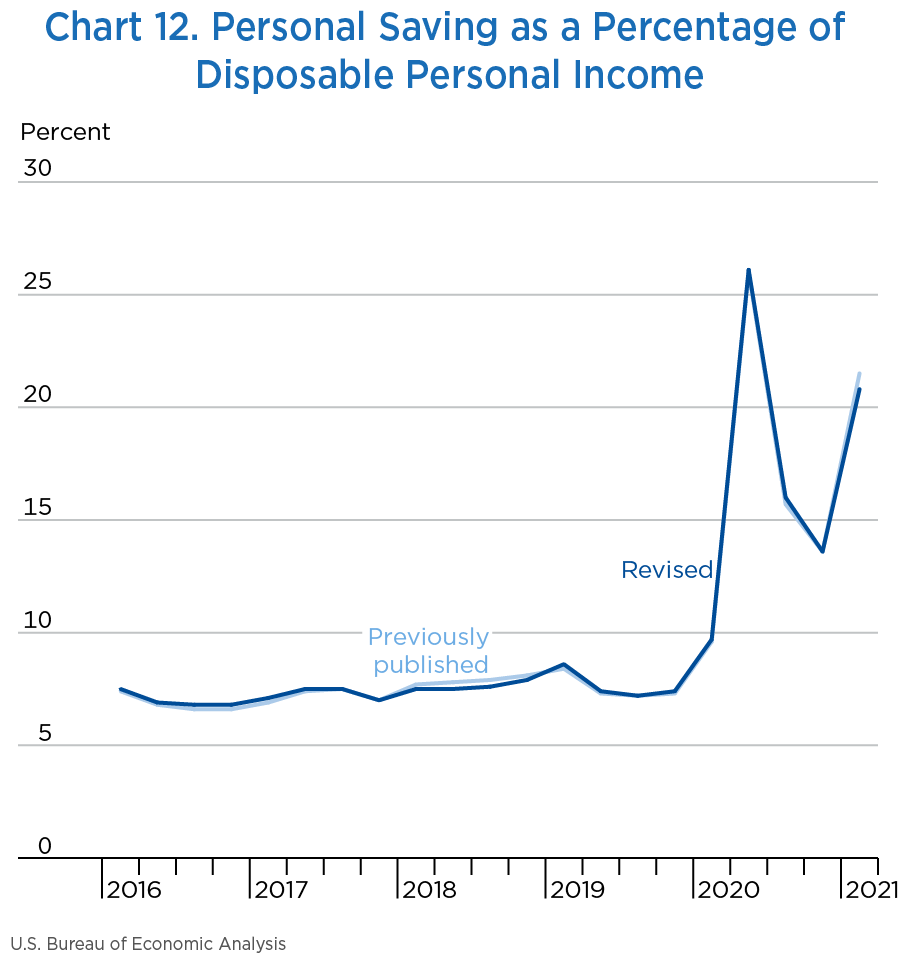
[Click chart to expand]
Table 13 presents the updated NIPA components with revisions of $5.0 billion or more (in absolute value) and lists the major source data that were incorporated as part of this year's update. Note that the incorporation of newly available and revised source data for a given year usually results in a revision to the level of an estimate both for that year and for subsequent years.
| Line | NIPA component and major source data incorporated1 | Revision in level | Level | ||||
|---|---|---|---|---|---|---|---|
| 2016 | 2017 | 2018 | 2019 | 2020 | 2020 | ||
| 1 | Gross domestic product | −50.0 | −63.4 | −84.7 | −60.6 | −42.8 | 20,893.7 |
| 2 | Personal consumption expenditures | −76.7 | −101.2 | −79.8 | −115.9 | −97.8 | 14,047.6 |
| 3 | Goods | −6.5 | −13.7 | −18.1 | −33.3 | −5.0 | 4,653.8 |
| 4 | Durable goods | −5.0 | −14.0 | −12.4 | −21.1 | −2.5 | 1,616.4 |
| 5 | Motor vehicles and parts
Revised trade source data on new vehicle units for 2016–2020; revised trade source data on new vehicle registrations for 2020. |
−1.2 | −2.3 | −3.8 | −7.3 | 6.0 | 541.3 |
| Of which: | |||||||
| 6 | Net purchases of used motor vehicles
Revised trade source data on cars and trucks in operation for 2016–2019; new Census Bureau Annual Retail Trade Survey (ARTS) data for retail and wholesale margins for 2019; new trade source data on cars and trucks in operation for 2020; revised Census Bureau Monthly Retail Trade Survey (MRTS) and Monthly Wholesale Trade Survey (MWTS) data on retail sales and wholesale sales of used motor vehicle dealers for 2020. Updated Motor Vehicle Retention Rates for 2016–2020, based on trade source data on cars and trucks in operation. |
−0.1 | −1.5 | −3.4 | −7.6 | 3.4 | 167.9 |
| 7 | Furnishings and durable household equipment | −0.9 | −2.0 | 2.2 | 2.8 | 9.8 | 390.4 |
| Of which: | |||||||
| 8 | Furniture and furnishings
Revised ARTS data for 2016–2018; new ARTS data for 2019; revised MRTS data for 2020; Census Ecommerce Report for 2016–2019. |
−0.4 | −1.1 | 3.3 | 3.9 | 6.6 | 245.4 |
| 9 | Recreational goods and vehicles | −2.0 | −7.8 | −7.9 | −12.4 | −14.2 | 476.2 |
| Of which: | |||||||
| 10 | Sports and recreational vehicles
Revised ARTS data for 2016–2018; new ARTS data for 2019; revised MRTS data for 2020. |
−0.4 | −0.5 | −0.7 | −4.5 | −7.8 | 75.1 |
| 11 | Other durable goods | −0.9 | −2.0 | −2.9 | −4.1 | −4.2 | 208.5 |
| 12 | Nondurable goods | −1.5 | 0.3 | −5.8 | −12.2 | −2.4 | 3,037.4 |
| 13 | Food and beverages purchased for off-premises consumption | 0.8 | 2.9 | 1.5 | 5.2 | 12.8 | 1,146.7 |
| Of which: | |||||||
| 14 | Food and nonalcoholic beverages purchased for off-premises consumption
Revised ARTS data for 2016–2018; new ARTS data for 2019; revised MRTS data for 2020; revised trade source retail scanner data for 2019; new trade source retail scanner data for 2020. |
1.5 | 4.0 | 3.0 | 6.3 | 12.9 | 979.3 |
| 15 | Clothing and footwear | −0.7 | 1.0 | −2.2 | −5.3 | 8.8 | 362.4 |
| Of which: | |||||||
| 16 | Garments
Revised ARTS data for 2016–2018; new ARTS data for 2019; revised MRTS data for 2020; revised Census Ecommerce Report for 2016–2018; new Census Ecommerce Report for 2019. |
−0.3 | 1.1 | −0.6 | −1.1 | 8.1 | 279.6 |
| 17 | Gasoline and other energy goods | 0.7 | 0.9 | 1.1 | 2.2 | −2.8 | 246.8 |
| 18 | Other nondurable goods | −2.3 | −4.5 | −6.2 | −14.3 | −21.3 | 1,281.5 |
| Of which: | |||||||
| 19 | Pharmaceutical and other medical products
Revised trade source data on prescription drug sales for 2019–2020. |
−0.4 | −0.3 | −0.2 | −4.5 | −5.8 | 576.7 |
| 20 | Recreational items
Revised ARTS data for 2016–2018; new ARTS data for 2019; revised MRTS data for 2020; Census Ecommerce Report for 2016–2019. |
−0.6 | −2.8 | −4.0 | −5.7 | −13.7 | 190.7 |
| 21 | Services | −70.2 | −87.5 | −61.6 | −82.6 | −92.8 | 9,393.7 |
| 22 | Household consumption expenditures (for services) | −70.9 | −88.8 | −67.5 | −83.4 | −92.6 | 8,872.9 |
| 23 | Housing and utilities | −77.6 | −96.3 | −98.1 | −109.7 | −116.1 | 2,668.1 |
| 24 | Housing | −77.6 | −95.7 | −101.1 | −108.1 | −110.6 | 2,315.7 |
| Of which: | |||||||
| 25 | Rental of tenant-occupied nonfarm housing
Revisions for 2002 through 2020 reflect new methodology for Housing output. Newly incorporated American Community Survey (ACS) data for 2005–2019; BEA projections for 2020; new Freddie Mac data on mortgage originations for 2020; new Federal Reserve Board (FRB) data on mortgage debt outstanding for 2020; new A.M. Best Co. data on property insurance for 2019. |
−75.2 | −86.8 | −80.1 | −84.3 | −88.7 | 559.0 |
| 26 | Imputed rental of owner-occupied nonfarm housing
Revisions for 2002 through 2020 reflect new methodology for Housing output. Newly incorporated American Community Survey (ACS) data for 2005–2019; BEA projections for 2020; new Freddie Mac data on mortgage originations for 2020; new Federal Reserve Board (FRB) data on mortgage debt outstanding for 2020; new A.M. Best Co. data on property insurance for 2019. |
−5.6 | −12.0 | −24.2 | −26.2 | −24.4 | 1,731.7 |
| 27 | Household utilities | 0.0 | −0.7 | 3.0 | −1.6 | −5.5 | 352.5 |
| Of which: | |||||||
| 28 | Electricity and gas | −0.1 | −1.3 | 2.4 | −2.5 | −6.4 | 240.1 |
| Of which: | |||||||
| 29 | Electricity | −0.5 | −1.4 | 0.1 | −3.6 | −5.1 | 189.7 |
| 30 | Health care | −5.7 | −9.5 | −5.4 | 7.3 | 0.5 | 2,308.4 |
| 31 | Outpatient services | 4.9 | 9.3 | 10.2 | 26.4 | 24.6 | 1,064.4 |
| Of which: | |||||||
| 32 | Physician services
Revised Service Annual Survey (SAS) taxable and tax-exempt revenue data for 2016 through 2019; revised QSS data for 2020. |
3.2 | 5.7 | 4.9 | 14.0 | 13.3 | 552.0 |
| 33 | Paramedical services
Revised SAS taxable revenue data for 2016 through 2019; revised QSS data for 2020. |
1.3 | 2.7 | 3.2 | 7.5 | 7.5 | 401.9 |
| 34 | Hospital and nursing home services | −10.6 | −18.8 | −15.6 | −19.1 | −24.1 | 1,244.0 |
| Of which: | |||||||
| 35 | Hospitals
Revised SAS taxable and tax-exempt revenue data for 2016 through 2019; revised QSS data for 2020. |
−10.2 | −17.6 | −15.7 | −23.2 | −20.2 | 1,061.4 |
| 36 | Transportation services | 0.3 | 0.6 | 2.7 | 11.9 | −3.3 | 363.4 |
| 37 | Motor vehicle services | 0.1 | 0.3 | −0.6 | 4.9 | 11.1 | 282.3 |
| Of which: | |||||||
| 38 | Motor vehicle maintenance and repair
Revised SAS taxable revenue and ARTS data for 2016 through 2019; Revised QSS for 2020. |
−0.1 | 0.3 | 0.1 | 4.6 | 8.2 | 183.3 |
| 39 | Public transportation | 0.2 | 0.3 | 3.3 | 7.0 | −14.3 | 81.2 |
| Of which: | |||||||
| 40 | Air transportation
Revised SAS taxable revenue data for 2016 through 2019; new Bureau of Transportation Statistics data for 2020. |
0.0 | 0.1 | 0.1 | 5.7 | −11.9 | 49.6 |
| 41 | Recreation services | 0.4 | 3.7 | 2.9 | 2.8 | 11.3 | 416.5 |
| Of which: | |||||||
| 42 | Gambling | −1.0 | −1.3 | −1.2 | −5.3 | 5.1 | 110.1 |
| 43 | Food services and accommodations | 0.0 | −0.2 | −0.4 | 8.8 | 5.8 | 801.5 |
| Of which: | |||||||
| 44 | Food services | 0.0 | −0.6 | −2.0 | 7.6 | 5.2 | 723.3 |
| Of which: | |||||||
| 45 | Purchased meals and beverages
Revised SAS taxable revenue data for 2016 through 2019; revised MRTS for 2020. |
0.0 | −0.6 | −2.0 | 7.5 | 5.5 | 703.6 |
| 46 | Financial services and insurance | 12.2 | 16.6 | 32.4 | −4.5 | −11.1 | 1,196.3 |
| 47 | Financial services | 11.6 | 15.8 | 19.5 | 7.3 | 10.0 | 756.4 |
| 48 | Financial services furnished without payment
Revised Federal Reserve Board (FRB) financial accounts of the United States data for 2016 to 2019; new FRB data for 2020; revised Internal Revenue Service (IRS) tabulations of corporate tax return data for 2018; new IRS tabulations of corporate and of sole proprietorship and partnership tax return data for 2019; new Federal Deposit Insurance Corporation (FDIC) data for 2020; new trade source data on credit unions and on investment companies for 2020. |
11.7 | 16.2 | 15.1 | 5.4 | −4.3 | 376.4 |
| 49 | Financial service charges, fees, and commissions
Revised SAS revenue data for 2016 through 2019; revised QSS data for 2020. |
−0.2 | −0.4 | 4.4 | 1.9 | 14.4 | 380.0 |
| 50 | Insurance | 0.6 | 0.8 | 12.9 | −11.8 | −21.1 | 439.9 |
| Of which: | |||||||
| 51 | Life insurance
Revised and newly available trade source data on life insurance company expenses for 2018 and 2019; new BLS Quarterly Census of Employment and Wages (QCEW) data for 2020. |
0.6 | 0.8 | 0.5 | −7.3 | −11.3 | 93.5 |
| 52 | Net health insurance
Revised benefits-to-premiums ratio based on trade source data on medical insurance for 2019; new Medical Expenditure Panel Survey data for 2019. BEA projections for 2020. |
0.0 | 0.0 | 12.4 | −1.1 | −4.5 | 252.5 |
| 53 | Net motor vehicle and other transportation insurance
Revised premium and loss data for 2018, newly available data for 2019 - 2020 from A.M. Best Co. |
0.0 | 0.0 | 0.0 | −3.6 | −5.7 | 82.4 |
| 54 | Other services | −0.4 | −3.6 | −1.5 | 0.0 | 20.3 | 1,118.5 |
| Of which: | |||||||
| 55 | Professional and other services | −0.6 | −1.6 | −1.5 | 0.9 | 6.4 | 198.5 |
| 56 | Net foreign travel2 | 0.5 | −1.9 | −0.5 | −1.9 | 7.9 | −20.6 |
| Of which: | |||||||
| 57 | Less: Expenditures in the United States by nonresidents
Revised Bureau of Economic Analysis (BEA) international transactions accounts (ITAs) data for 2016–2020. |
0.0 | 2.6 | 4.3 | 6.0 | −3.9 | 74.6 |
| 58 | Final consumption expenditures of NPISH | 0.7 | 1.2 | 5.9 | 0.7 | −0.2 | 520.9 |
| 59 | Gross output of nonprofit institutions
Revised SAS tax-exempt expenses data for 2016 through 2019; revised Census Bureau Quarterly Services Survey (QSS) data for 2020. |
−6.2 | −13.1 | −9.2 | −14.5 | −8.3 | 1,644.8 |
| 60 | Less: Receipts from sales of goods and services by nonprofit institutions
Revised SAS revenue data for 2016 through 2019; revised QSS data for 2020. |
−6.9 | −14.4 | −15.1 | −15.2 | −8.2 | 1,123.9 |
| 61 | Gross private domestic investment | 16.7 | 30.2 | 4.9 | 75.0 | 33.1 | 3,637.8 |
| 62 | Fixed investment | 8.8 | 17.1 | 3.9 | 50.5 | 19.8 | 3,697.4 |
| 63 | Nonresidential | 8.8 | 17.1 | 3.9 | 43.7 | 7.3 | 2,799.6 |
| 64 | Structures | 0.1 | 0.2 | 1.9 | 22.4 | 12.5 | 597.2 |
| 65 | Commercial and health care
Revised Census Bureau construction spending (value-put-in-place) data for 2019–2020. |
0.0 | 0.0 | 0.0 | 7.6 | 8.5 | 204.7 |
| Of which: | |||||||
| 66 | Office | 0.0 | 0.0 | 0.0 | 4.1 | 6.0 | 86.5 |
| 67 | Power and communication | 0.0 | 0.0 | 0.0 | 3.3 | −5.0 | 130.3 |
| Of which: | |||||||
| 68 | Power
Revised Census Bureau construction spending (value-put-in-place) data for 2019–2020. |
0.0 | 0.0 | 0.0 | 3.3 | −4.9 | 107.9 |
| Of which: | |||||||
| 69 | Other power | 0.0 | 0.0 | 0.0 | 1.4 | −8.6 | 25.1 |
| 70 | Mining exploration, shafts, and wells | 0.1 | 0.1 | 1.6 | 6.7 | 2.6 | 75.6 |
| 71 | Other structures
Revised Census Bureau construction spending (value-put-in-place) data for 2019–2020. |
0.0 | 0.1 | 0.3 | 4.1 | 5.1 | 117.2 |
| 72 | Equipment | −0.8 | −4.9 | −22.9 | −9.6 | −52.9 | 1,123.9 |
| 73 | Information processing equipment | −0.2 | −2.1 | −5.7 | −3.4 | −5.9 | 413.9 |
| Of which: | |||||||
| 74 | Computers and peripheral equipment
For 2020, revision to capitalized systems integration services based on Census Bureau QSS revenue data. |
0.4 | −1.4 | 0.0 | −2.5 | −9.1 | 128.1 |
| 75 | Communication equipment
For 2019, new Census Bureau Annual Survey of Manufacturers (ASM) data; revised Census Bureau monthly industry shipments data for 2020. |
−0.2 | −1.5 | 1.4 | 4.5 | 5.0 | 122.0 |
| 76 | Industrial equipment | −0.3 | −2.9 | −8.8 | −9.0 | −10.3 | 241.7 |
| 77 | Transportation equipment | 0.3 | 2.0 | 0.0 | 10.0 | −35.1 | 206.0 |
| Of which: | |||||||
| 78 | Trucks, buses, and truck trailers | −2.3 | 1.2 | 4.7 | 4.8 | −28.0 | 150.7 |
| Of which: | |||||||
| 79 | Light trucks (including utility vehicles)
For 2016–2019, revised motor vehicle in operation data and revised motor vehicle retention rates from trade source; for 2020, new motor vehicle in operation data from trade source. |
−2.2 | −0.5 | 1.1 | 3.0 | −27.2 | 104.3 |
| 80 | Autos
For 2016–2019, revised motor vehicle in operation data and revised motor vehicle retention rates from trade source; for 2020, new motor vehicle in operation data from trade source. |
1.1 | 1.6 | 2.4 | 3.9 | −8.6 | 8.0 |
| 81 | Aircraft
For 2018, revised Census Bureau ASM data; for 2019, new Census Bureau ASM data. Revised Census Bureau monthly industry shipments data for 2020. |
−0.1 | 1.0 | −7.6 | 3.1 | 5.5 | 31.2 |
| 82 | Other equipment | −0.5 | −0.2 | −8.8 | −8.7 | −4.9 | 268.3 |
| Of which: | |||||||
| 83 | Agricultural machinery
For 2018, revised Census Bureau ASM data; for 2019, new Census Bureau ASM data. Revised Census Bureau monthly industry shipments data for 2020. |
−0.1 | 1.2 | −6.1 | −5.4 | −3.5 | 42.3 |
| 84 | Other
For 2018, revised Census Bureau ASM data; for 2019, new Census Bureau ASM data. Revised Census Bureau monthly industry shipments data for 2020. |
−0.5 | 0.7 | 2.5 | 1.9 | 5.5 | 72.3 |
| 85 | Intellectual property products | 9.6 | 21.8 | 24.9 | 30.9 | 47.6 | 1,078.5 |
| 86 | Software | 7.5 | 16.5 | 18.6 | 16.5 | 23.9 | 453.4 |
| Of which: | |||||||
| 87 | Prepackaged
Revised Census Bureau SAS revenue data for 2016–2019; revised QSS revenue data for 2020. |
4.5 | 9.4 | 10.3 | 11.0 | 14.2 | 212.5 |
| 88 | Custom
Revised Census Bureau SAS revenue data for 2016–2019; revised QSS revenue data for 2020. |
3.1 | 7.1 | 8.3 | 5.6 | 7.5 | 165.5 |
| 89 | Research and development
New National Science Foundation (NSF) business enterprise research and development survey data (BERD) for 2019; revised service annual survey (SAS) data on expenses and receipts of tax-exempt scientific research and development services establishments for 2016–2019; revised public financial reports on research and development (R&D) expenses data and revised QSS revenue data for 2020. |
1.1 | 3.6 | 4.3 | 12.5 | 21.4 | 537.7 |
| Of which: | |||||||
| 90 | Business | 1.1 | 3.3 | 3.3 | 13.3 | 21.2 | 511.0 |
| Of which: | |||||||
| 91 | Nonmanufacturing | 1.7 | 4.0 | 6.2 | 17.8 | 20.3 | 215.3 |
| Of which: | |||||||
| 92 | All other nonmanufacturing | 1.6 | 3.8 | 5.9 | 16.1 | 20.0 | 204.5 |
| 93 | Entertainment, literary, and artistic originals | 1.0 | 1.8 | 2.0 | 1.9 | 2.3 | 87.4 |
| 94 | Residential | 0.0 | −0.1 | 0.0 | 6.8 | 12.6 | 897.8 |
| 95 | Structures | 0.0 | 0.0 | 0.1 | 6.9 | 12.7 | 883.4 |
| 96 | Permanent site | 0.0 | 0.0 | 0.0 | 1.8 | 8.5 | 381.9 |
| Of which: | |||||||
| 97 | Single-family structures
Revised Census Bureau construction spending (value-put-in-place) data for 2020. |
0.0 | 0.0 | 0.0 | 0.0 | 7.6 | 309.4 |
| 98 | Other structures | 0.0 | 0.0 | 0.1 | 5.1 | 4.1 | 501.5 |
| 99 | Residential equipment | −0.1 | −0.1 | −0.1 | −0.1 | −0.1 | 14.3 |
| 100 | Change in private inventories | 7.9 | 13.2 | 1.0 | 24.5 | 13.2 | −59.6 |
| 101 | Farm
Revised U.S. Department of Agriculture (USDA) data for 2016–2020 |
0.0 | 0.0 | −1.2 | −0.7 | −7.1 | −6.0 |
| 102 | Nonfarm
Revised Annual Wholesale Trade Survey (AWTS) data (2016); revised Economic Census, AWTS, and ARTS data (2017); revised ASM data (2018); new ASM data (2019); revised Census Bureau monthly inventory data and BEA wages (2020). |
7.9 | 13.2 | 2.1 | 25.3 | 20.3 | −53.6 |
| 103 | Change in book value
Revised AWTS data for 2016 and 2017; revised and new ASM data for 2018 and 2019; revised Census Bureau monthly inventory data for 2020. |
5.9 | 3.9 | −9.4 | 19.6 | 14.2 | −34.6 |
| 104 | Mining, utilities, and construction
Revised Census Bureau Quarterly Financial Report (QFR) and Statistics of Income (SOI) data for 2019. |
0.0 | 0.0 | 0.4 | 7.6 | 0.6 | −0.8 |
| 105 | Manufacturing
Revised ASM data for 2016 and 2018; revised Economic Census data for 2017;New ASM data for 2019; revised Census Bureau monthly inventory data for 2020. |
−2.1 | −3.2 | −3.2 | 14.4 | 1.4 | −3.1 |
| 106 | Wholesale trade
Revised and newly available AWTS data for 2016–2019; revised Census Bureau monthly inventory data for 2020. |
7.7 | 9.0 | −1.1 | 6.8 | 4.0 | −12.6 |
| 107 | Merchant wholesale | 3.7 | 3.8 | −1.3 | 3.6 | 3.4 | −7.1 |
| 108 | Nonmerchant wholesale
Revised and newly available AWTS data for 2016–2019; revised Census Bureau monthly inventory data for 2020. |
4.0 | 5.1 | 0.2 | 3.2 | 0.6 | −5.4 |
| 109 | Retail trade
Newly available ARTS data for 2019; revised Census Bureau monthly inventory data for 2020. |
−0.5 | −1.7 | −2.1 | −4.4 | 13.0 | −13.4 |
| 110 | Retail motor vehicle dealers
Revised and newly available ARTS data and revised unit-based motor vehicles data for 2016–2020; revised Census Bureau monthly inventory data for 2020. |
0.2 | −0.4 | −1.0 | −3.6 | 11.8 | −17.8 |
| 111 | Other industries
New SAS and SOI data for 2018–2019; revised QFR data for 2019; revised BEA wage data for 2020. |
0.7 | −0.2 | −3.5 | −4.8 | −4.9 | −4.7 |
| 112 | Inventory valuation adjustment (IVA)
Revised and newly available SOI data (2016); revised ARTS data (2017); Revised 2018 ASM data and newly available 2019 ASM data; newly available AWTS LIFO data (2019). |
2.1 | 9.3 | 11.6 | 6.3 | 6.1 | −19.0 |
| 113 | Net exports of goods and services2
Revised ITA data for 1999–2020. |
6.3 | 15.6 | 13.3 | 14.2 | −6.4 | −651.2 |
| 114 | Exports of goods and services | 4.9 | 9.2 | 4.8 | 5.0 | −3.7 | 2,123.4 |
| 115 | Exports of goods | 3.6 | 4.9 | 5.4 | 5.0 | −1.4 | 1,416.6 |
| Of which: | |||||||
| 116 | Other
New data source (Census Bureau data on trade in goods) for the territorial adjustment (1999–2020). |
3.6 | 4.9 | 5.5 | 5.5 | 4.1 | 64.5 |
| 117 | Exports of services | 1.4 | 4.3 | −0.6 | 0.0 | −2.4 | 706.8 |
| 118 | Imports of goods and services | −1.3 | −6.4 | −8.5 | −9.2 | 2.6 | 2,774.6 |
| 119 | Imports of goods | −2.4 | −7.0 | −6.5 | −7.7 | 0.6 | 2,309.2 |
| Of which: | |||||||
| 120 | Other
New data source (Census Bureau data on trade in goods) for the territorial adjustment (1999–2020). |
−2.4 | −7.0 | −4.4 | −4.3 | −4.8 | 128.4 |
| 121 | Imports of services | 1.1 | 0.6 | −2.0 | −1.5 | 2.0 | 465.4 |
| Of which: | |||||||
| 122 | Transport | 0.0 | 0.0 | 4.1 | 5.3 | 4.4 | 72.4 |
| 123 | Other business services | 6.9 | 9.0 | 6.0 | 7.0 | 5.9 | 284.5 |
| 124 | Other | −5.9 | −8.4 | −11.0 | −11.4 | −6.7 | 5.1 |
| 125 | Government consumption expenditures and gross investment | 3.8 | −8.0 | −23.1 | −34.0 | 28.2 | 3,859.5 |
| 126 | Federal government | −0.2 | −1.1 | −0.5 | −4.2 | 17.3 | 1,501.8 |
| 127 | Consumption expenditures
Revised allocations of FY 2018 and FY 2019 Office of Management and Budget (OMB) Budget data for 2018 and 2019; revised FY 2020 OMB Budget data for 2019 and 2020; new preliminary FY 2021 OMB Budget data for 2020. |
−0.9 | −2.4 | −4.1 | 0.1 | 18.9 | 1,161.4 |
| Of which: | |||||||
| 128 | Compensation of general government employees | 0.4 | 0.2 | 0.2 | 0.0 | 7.8 | 488.6 |
| 129 | Services
Revised allocations of FY 2018 and FY 2019 Office of Management and Budget (OMB) Budget data for 2018 and 2019; revised FY 2020 OMB Budget data for 2019 and 2020; new preliminary FY 2021 OMB Budget data for 2020. |
−0.3 | −1.9 | −1.6 | 3.6 | 9.8 | 332.2 |
| 130 | Gross investment | 0.7 | 1.3 | 3.6 | −4.3 | −1.6 | 340.3 |
| Of which: | |||||||
| 131 | Intellectual property products | 0.7 | 1.1 | 3.9 | −4.9 | −5.2 | 195.0 |
| Of which: | |||||||
| 132 | Research and development | 0.0 | −0.5 | 2.1 | −6.3 | −6.7 | 152.4 |
| 133 | National defense
Revised allocations of FY 2018 and FY 2019 Office of Management and Budget (OMB) Budget data for 2018 and 2019; revised FY 2020 OMB Budget data for 2019 and 2020; new preliminary FY 2021 OMB Budget data for 2020. |
−0.8 | −0.7 | −1.6 | −4.9 | −4.3 | 881.3 |
| 134 | Nondefense
Revised allocations of FY 2018 and FY 2019 Office of Management and Budget (OMB) Budget data for 2018 and 2019; revised FY 2020 OMB Budget data for 2019 and 2020; new preliminary FY 2021 OMB Budget data for 2020. |
0.6 | −0.4 | 1.1 | 0.6 | 21.6 | 620.5 |
| 135 | Consumption expenditures
Revised allocations of FY 2018 and FY 2019 Office of Management and Budget (OMB) Budget data for 2018 and 2019; revised FY 2020 OMB Budget data for 2019 and 2020; new preliminary FY 2021 OMB Budget data for 2020. |
0.1 | −2.0 | −5.5 | −3.9 | 16.3 | 461.0 |
| Of which: | |||||||
| 136 | Compensation of general government employees | 0.2 | 0.1 | 0.2 | 0.3 | 4.8 | 208.5 |
| 137 | Services
Revised allocations of FY 2018 and FY 2019 Office of Management and Budget (OMB) Budget data for 2018 and 2019; revised FY 2020 OMB Budget data for 2019 and 2020; new preliminary FY 2021 OMB Budget data for 2020. |
0.3 | −0.9 | −3.5 | −2.2 | 8.1 | 119.9 |
| 138 | Gross investment | 0.5 | 1.7 | 6.6 | 4.5 | 5.3 | 159.5 |
| Of which: | |||||||
| 139 | Intellectual property products | 0.5 | 1.7 | 7.0 | 4.1 | 2.5 | 121.3 |
| Of which: | |||||||
| 140 | Research and development
Revised BLS QCEW data for 2016–2019. New QCEW for 2020. |
0.0 | 0.6 | 5.8 | 3.2 | 1.4 | 92.2 |
| 141 | State and local | 4.0 | −6.9 | −22.7 | −29.7 | 10.9 | 2,357.8 |
| 142 | Consumption expenditures | 3.2 | −9.6 | −17.8 | −21.3 | 22.1 | 1,916.5 |
| Of which: | |||||||
| 143 | Compensation of general government employees
Revised BLS QCEW data for 2016–2019. New QCEW for 2020. |
−0.4 | 0.1 | −0.8 | −10.1 | 32.2 | 1,459.8 |
| 144 | Services
Revised Census Bureau government finances FY 2017–FY 2018 tabulations for 2016–2018; new government finances FY 2019 tabulations for 2018 and 2019. |
−1.0 | −9.2 | −11.3 | −9.2 | −11.3 | 495.2 |
| 145 | Less: Sales to other sectors
Revised Census Bureau government finances FY 2017–FY 2018 tabulations for 2016–2018; new government finances FY 2019 tabulations for 2018 and 2019. |
−4.6 | −3.1 | 2.1 | −0.4 | −5.4 | 493.9 |
| Of which: | |||||||
| 146 | Tuition and related educational charges | −0.1 | −0.3 | −1.3 | −1.8 | −6.0 | 97.4 |
| 147 | Health and hospital charges | −4.0 | −2.6 | 1.6 | −0.3 | 5.0 | 250.9 |
| 148 | Gross investment | 0.8 | 2.7 | −4.9 | −8.5 | −11.2 | 441.2 |
| Of which: | |||||||
| 149 | Structures
Revised Census Bureau government finances FY 2017–FY 2018 tabulations for 2016– new government finances FY 2019 tabulations for 2018 and 2019. |
0.7 | 2.6 | −4.7 | −8.1 | −13.6 | 345.5 |
| 150 | Gross domestic product | −50.0 | −63.4 | −84.7 | −60.6 | −42.8 | 20,893.7 |
| 151 | Less: Statistical discrepancy3 | −1.2 | 12.5 | −67.5 | −82.5 | −143.5 | −170.6 |
| 152 | Equals: Gross domestic income | −48.7 | −75.9 | −17.3 | 21.8 | 100.7 | 21,064.3 |
| 153 | Compensation of employees, paid
See entries for components under Compensation of employees, line 267, and additional source data below. |
2.3 | 3.7 | 9.2 | 15.0 | 79.0 | 11,580.1 |
| 154 | Wages and salaries | 2.1 | 3.3 | 6.1 | 13.9 | 71.2 | 9,452.0 |
| 155 | To persons
Revised QCEW data for 2016 through 2020; new IRS exact match data on nonfilers for 2019; new Census data on wages paid to tipped employees for 2020; new Bureau of Labor Statistics (BLS) data on wages not covered by the QCEW program for 2020. |
2.1 | 3.2 | 6.0 | 13.8 | 73.4 | 9,437.6 |
| 156 | To the rest of the world | 0.0 | 0.1 | 0.1 | 0.1 | −2.3 | 14.4 |
| 157 | Supplements to wages and salaries | 0.1 | 0.4 | 3.1 | 1.1 | 7.9 | 2,128.0 |
| 158 | Taxes on production and imports
FY 2017–FY 2019 Census Bureau Annual State Tax Collection Survey (STC) data, preliminary FY 2020 STC data, and a FY 2021 extrapolation. FY 2017–FY 2018 Census Bureau Local Government Finance Data, preliminary FY 2019 data. |
−0.1 | 2.3 | 17.0 | 40.9 | 53.0 | 1,534.7 |
| 159 | Less: Subsidies
FY 2022 federal budget |
0.0 | 0.0 | 0.0 | −0.9 | 15.0 | 761.4 |
| 160 | Net operating surplus | −51.3 | −87.2 | −51.9 | −49.6 | −33.1 | 5,135.0 |
| 161 | Private enterprises | −51.2 | −85.8 | −49.1 | −43.9 | −34.0 | 5,152.5 |
| 162 | Current surplus of government enterprises
Revised Census Bureau government finances FY 2017–FY 2018 tabulations for 2016–2018; new government finances FY 2019 tabulations for 2018 and 2019. |
−0.1 | −1.4 | −2.7 | −5.7 | 0.9 | −17.5 |
| 163 | Consumption of fixed capital | 0.5 | 5.3 | 8.4 | 14.6 | 16.8 | 3,575.9 |
| 164 | Private | 1.6 | 6.4 | 9.1 | 16.0 | 18.6 | 2,969.6 |
| 165 | Domestic business
Revised BEA fixed investment and price estimates for 2015–2019. |
1.4 | 5.8 | 8.3 | 14.7 | 16.4 | 2,338.6 |
| 166 | Capital consumption allowances
Revised IRS tabulations of corporate tax return data for 2017; new IRS tabulations of corporate and of sole proprietorship and partnership tax return data for 2018; revised Office of Tax Analysis bonus depreciation estimates for 2015–2019; revised BEA fixed investment estimates for 2015–2019. |
0.9 | 1.2 | −11.8 | 125.9 | 120.8 | 2,754.7 |
| 167 | Less: Capital consumption adjustment (CCAdj) | −0.6 | −4.7 | −20.0 | 111.2 | 104.4 | 416.1 |
| 168 | Households and institutions | 0.1 | 0.6 | 0.8 | 1.3 | 2.2 | 631.0 |
| 169 | Government | −1.1 | −1.1 | −0.7 | −1.3 | −1.8 | 606.4 |
| 170 | Plus: Income receipts from the rest of the world
Revised ITA data for 1999–2020. |
0.0 | 0.0 | −0.8 | −9.5 | 19.1 | 992.9 |
| 171 | Less: Income payments to the rest of the world
Revised ITA data for 1999–2020. |
0.1 | −2.3 | −10.2 | −6.3 | 0.9 | 770.6 |
| 172 | Equals: Gross national income | −48.8 | −73.6 | −7.8 | 18.6 | 119.0 | 21,286.6 |
| 173 | Less: Consumption of fixed capital | 0.5 | 5.3 | 8.4 | 14.6 | 16.8 | 3,575.9 |
| 174 | Equals: National income | −49.3 | −78.9 | −16.2 | 4.0 | 102.2 | 17,710.7 |
| 175 | Compensation of employees
See entries for components under Compensation of employees, line 267, and additional source data below. |
2.3 | 3.6 | 9.4 | 15.3 | 81.5 | 11,572.2 |
| 176 | Wages and salaries | 2.1 | 3.2 | 6.3 | 14.2 | 73.6 | 9,444.1 |
| 177 | Government
Revised QCEW data for 2016 through 2019; new QCEW data for 2020; revised FY 2020 OMB Budget data for 2019 and 2020; new preliminary FY 2021 OMB Budget data for 2020. |
−0.2 | 0.2 | −1.1 | −0.6 | 49.0 | 1,494.5 |
| 178 | Other | 2.3 | 3.0 | 7.4 | 14.8 | 24.6 | 7,949.6 |
| 179 | Supplements to wages and salaries | 0.1 | 0.4 | 3.1 | 1.1 | 7.9 | 2,128.0 |
| 180 | Employer contributions for employee pension and insurance funds
New Department of Labor pension data for 2018 and 2019; revised Pension Benefit Guaranty Corporation (PBGC) data for 2018; new PBGC data for 2019; revised FRB Financial Accounts of the United States data for 2018 and 2019; new FRB data for 2020; new Department of Health and Human Services medical expenditure panel survey data for 2019 and 2020. |
0.4 | 0.5 | 3.6 | 0.6 | 7.3 | 1,464.4 |
| 181 | Employer contributions for government social insurance | −0.3 | −0.1 | −0.5 | 0.5 | 0.5 | 663.7 |
| 182 | Proprietors' income with IVA and CCAdj
Revised U.S. Department of Agriculture (USDA) data for 2016–2020. |
−1.5 | −3.2 | −5.5 | −58.8 | −45.1 | 1,650.0 |
| 183 | Farm | −2.0 | −2.1 | −4.1 | −11.2 | 5.5 | 70.2 |
| 184 | Proprietors' income with IVA | −2.0 | −2.1 | −4.1 | −11.2 | 5.6 | 76.9 |
| 185 | Capital consumption adjustment | 0.0 | 0.0 | 0.0 | 0.0 | −0.1 | −6.7 |
| 186 | Nonfarm | 0.5 | −1.1 | −1.4 | −47.6 | −50.6 | 1,579.9 |
| 187 | Proprietors' income
Revised IRS tabulations of corporate tax return data for the posttabulation adjustments for 2018; new IRS tabulations of sole proprietorship and partnership tax return data for 2019; new Census Bureau nonfiler income data for 2019. |
−0.2 | −0.3 | 0.3 | −64.3 | −58.6 | 1,214.8 |
| 188 | IVA | 0.8 | 0.8 | 1.0 | 0.2 | −0.3 | −3.4 |
| 189 | CCAdj | −0.1 | −1.6 | −2.7 | 16.5 | 8.3 | 368.4 |
| 190 | Rental income of persons with CCAdj | −56.0 | −69.2 | −77.4 | −95.0 | −90.2 | 711.6 |
| 191 | Rental income of persons
Revisions for 2002 through 2020 reflect new methodology for Housing output. Newly incorporated American Community Survey (ACS) data for 2005–2019; BEA projections for 2020; new census of governments property tax data for 2019; new Freddie Mac data on mortgage originations for 2020; new Federal Reserve Board (FRB) data on mortgage debt outstanding for 2020; new A.M. Best Corporation data on property insurance for 2019. |
−56.0 | −69.2 | −77.4 | −95.0 | −90.4 | 735.1 |
| 192 | Capital consumption adjustment | 0.0 | 0.0 | 0.0 | 0.0 | 0.2 | −23.5 |
| 193 | Corporate profits with IVA and CCAdj
Revised IRS tabulations of corporate tax return data for 2018; new IRS tabulations for 2019; revised Census Bureau QFR data for 2020; regulatory agency and public financial reports profits data for 2020. |
14.0 | 14.4 | 62.0 | 117.3 | 123.5 | 2,243.8 |
| 194 | Domestic industries | 14.0 | 12.7 | 52.8 | 109.3 | 100.2 | 1,789.0 |
| 195 | Financial | 1.5 | −0.9 | 25.5 | 44.9 | 5.5 | 467.0 |
| 196 | Nonfinancial | 12.5 | 13.6 | 27.3 | 64.5 | 94.7 | 1,322.0 |
| 197 | Rest of the world
Revised BEA international transactions accounts estimates for 2016–2020. |
0.0 | 1.7 | 9.2 | 8.0 | 23.3 | 454.7 |
| 198 | Less: CCAdj
See entries under Consumption of fixed capital, line 163. |
−0.5 | −3.0 | −17.3 | 94.7 | 95.9 | 77.9 |
| 199 | Equals: Corporate profits with IVA | 14.4 | 17.4 | 79.3 | 22.6 | 27.6 | 2,165.9 |
| 200 | Domestic industries | 14.5 | 15.7 | 70.1 | 14.6 | 4.3 | 1,711.2 |
| 201 | Financial | 1.6 | 0.1 | 32.1 | 62.7 | 27.2 | 502.5 |
| 202 | Federal Reserve banks | 0.0 | 0.0 | 0.0 | 11.7 | 12.3 | 92.9 |
| 203 | Other financial | 1.6 | 0.1 | 32.1 | 50.9 | 14.9 | 409.6 |
| 204 | Nonfinancial | 12.9 | 15.6 | 38.0 | −48.0 | −22.9 | 1,208.7 |
| 205 | Utilities | 0.0 | 0.0 | 0.3 | −19.5 | −17.0 | 10.4 |
| 206 | Manufacturing | 4.1 | 12.0 | 9.0 | 19.2 | 44.2 | 328.8 |
| 207 | Durable goods | 2.2 | 5.8 | 7.4 | 2.1 | 27.2 | 188.5 |
| 208 | Nondurable goods | 1.9 | 6.2 | 1.6 | 17.1 | 17.0 | 140.4 |
| 209 | Wholesale trade | 1.3 | 1.2 | 8.7 | 6.5 | 15.0 | 123.7 |
| 210 | Retail trade | 4.7 | 0.5 | 1.6 | −8.9 | 3.5 | 218.5 |
| 211 | Transportation and warehousing | 0.7 | 0.7 | −4.2 | −18.8 | −12.0 | 19.2 |
| 212 | Information | 0.4 | 1.0 | 1.1 | −3.0 | 4.5 | 134.9 |
| 213 | Other nonfinancial | 1.8 | 0.1 | 21.4 | −23.5 | −61.1 | 373.1 |
| 214 | Rest of the world | 0.0 | 1.7 | 9.2 | 8.0 | 23.3 | 454.7 |
| 215 | Less: IVA | 5.2 | 5.8 | 7.0 | 5.3 | 3.5 | −18.2 |
| 216 | Equals: Corporate profits before tax without IVA and CCAdj | 9.2 | 11.5 | 72.3 | 17.3 | 24.1 | 2,184.1 |
| 217 | Domestic industries | 9.3 | 9.9 | 63.2 | 9.3 | 0.8 | 1,729.3 |
| 218 | Financial | 1.6 | 0.1 | 32.1 | 62.7 | 27.2 | 502.5 |
| 219 | Nonfinancial | 7.6 | 9.8 | 31.1 | −53.3 | −26.4 | 1,226.8 |
| 220 | Rest of the world | 0.0 | 1.7 | 9.2 | 8.0 | 23.3 | 454.7 |
| 221 | Receipts from the rest of the world | 0.0 | 0.7 | −0.1 | −6.5 | 12.5 | 765.9 |
| 222 | Less: Payments to the rest of the world | 0.0 | −0.9 | −9.3 | −14.4 | −10.8 | 311.2 |
| 223 | Less: Taxes on corporate income | 0.0 | 1.0 | −1.3 | 3.5 | −10.0 | 275.6 |
| 224 | Equals: Profits after tax | 9.2 | 10.6 | 73.7 | 13.8 | 34.1 | 1,908.4 |
| 225 | Domestic industries | 9.3 | 8.9 | 64.5 | 5.9 | 10.8 | 1,453.7 |
| 226 | Rest of the world | 0.0 | 1.7 | 9.2 | 8.0 | 23.3 | 454.7 |
| 227 | Less: Net corporate dividend payments, National Income and Product Accounts | 0.0 | −6.3 | −51.7 | 25.6 | 28.8 | 1,394.9 |
| 228 | Domestic industries | 0.0 | 0.0 | −36.7 | 24.3 | 156.9 | 1,086.1 |
| 229 | Rest of the world | 0.0 | −6.3 | −15.0 | 1.3 | −128.1 | 308.7 |
| 230 | Equals: Undistributed corporate profits | 9.2 | 16.9 | 125.4 | −11.7 | 5.3 | 513.6 |
| 231 | Domestic industries | 9.3 | 8.9 | 101.2 | −18.4 | −146.1 | 367.6 |
| 232 | Rest of the world | 0.0 | 8.0 | 24.2 | 6.7 | 151.4 | 146.0 |
| 233 | Net interest and miscellaneous payments
Revised corporate SOI for 2018; newly available corporate SOI for 2019; newly available sole proprietors and partnerships SOI for 2018. Updated extrapolation for 2019 based newly available SOI. |
−10.0 | −23.9 | −20.4 | −15.2 | −0.3 | 618.8 |
| 234 | Net interest | −9.8 | −23.6 | −19.8 | −15.3 | −1.4 | 600.0 |
| 235 | Domestic business | −8.2 | −23.2 | −21.1 | −7.2 | ... | 520.5 |
| 236 | Monetary interest paid
Newly available corporate SOI for 2019; revised corporate SOI for 2018; newly available sole proprietors and partnerships SOI for 2018. |
−14.4 | −27.9 | −38.2 | 4.0 | ... | 1,706.2 |
| 237 | Less: Monetary interest received
Newly available corporate SOI for 2019; revised corporate SOI for 2018; newly available sole proprietors and partnerships SOI for 2018. |
4.1 | 10.5 | −5.2 | 10.5 | ... | 2,101.2 |
| 238 | Imputed interest paid, depositor, insurance, and pension services | 1.1 | 8.8 | 14.3 | 12.9 | ... | 1,181.1 |
| 239 | Financial
Revised implicit and direct commisions received by regulated investment companies; newly available American Council for Life Insurers (ACLI) data on net investment income; revised imputed interest paid by State & Local pension plans for 2019. |
3.7 | 10.9 | 13.2 | 6.1 | ... | 1,171.2 |
| Of which: | |||||||
| 240 | Banks, credit agencies, and investment companies | 7.6 | 13.5 | 13.9 | 4.1 | ... | 351.3 |
| 241 | Nonfinancial | −2.6 | −2.1 | 1.1 | 6.8 | ... | 9.9 |
| 242 | Less: Imputed interest received, depositor, insurance, and pension services | −4.1 | −2.1 | 2.5 | 9.9 | ... | 410.3 |
| 243 | Imputed interest paid, borrower services | −1.2 | 0.5 | 5.5 | 9.4 | ... | −166.4 |
| 244 | Less: Imputed interest received, borrower services | −6.3 | −3.9 | 5.5 | 13.2 | ... | −311.1 |
| 245 | Owner-occupied housing | −1.6 | −1.2 | 0.8 | 2.8 | ... | 298.2 |
| 246 | Nonprofit institutions | 0.0 | 0.2 | 0.4 | 0.6 | ... | 5.8 |
| 247 | Rest of the world
Revised monetary and imputed payments and receipts from the ITAs for 1999–2020. |
−0.1 | 0.6 | 0.1 | −11.5 | −7.5 | −224.4 |
| 248 | Miscellaneous payments | −0.2 | −0.4 | −0.6 | 0.1 | 1.0 | 18.8 |
| 249 | Federal rents and royalties | 0.0 | 0.0 | 0.0 | −0.1 | −0.1 | 5.5 |
| 250 | State and local rents and royalties | −0.2 | −0.4 | −0.6 | 0.2 | 1.2 | 13.3 |
| 251 | Taxes on production and imports | −0.1 | 2.3 | 17.0 | 40.9 | 53.0 | 1,534.7 |
| 252 | Federal
Tax receipts data from Statistics of Income Division of the IRS for FY 2019; projections from Office of Tax Analysis; the FY 2022 federal budget. |
0.1 | 0.7 | 0.9 | 1.0 | 5.3 | 158.0 |
| 253 | State and local
FY 2017–FY 2019 Census Bureau Annual State Tax Collection Survey (STC) data, preliminary FY 2020 STC data. FY 2017–FY 2018 Census Bureau Local Government Finance Data, preliminary FY 2019 data. |
−0.2 | 1.7 | 16.1 | 39.9 | 47.7 | 1,376.6 |
| 254 | Less: Subsidies | 0.0 | 0.0 | 0.0 | −0.9 | 15.0 | 761.4 |
| 255 | Federal FY 2022 federal budget. |
0.0 | 0.0 | 0.0 | −0.9 | 15.0 | 760.8 |
| 256 | State and local | 0.0 | 0.0 | 0.0 | 0.0 | 0.0 | 0.6 |
| 257 | Business current transfer payments (net) | 2.3 | −1.6 | 1.5 | 4.3 | −6.0 | 158.6 |
| 258 | To persons (net)
Revised trade source data on insurance benefits for 2016–2020; revised IRS tabulations of corporate gifts for 2018 and new tabulations for 2019. |
0.1 | −0.1 | 2.8 | 8.8 | 12.7 | 59.9 |
| 259 | To government (net) | −0.2 | 0.0 | 2.8 | 6.7 | 7.6 | 97.8 |
| 260 | To the rest of the world (net)
Revised ITA data for 2013–2020. |
2.4 | −1.5 | −4.1 | −11.2 | −26.3 | 0.9 |
| 261 | Current surplus of government enterprises | −0.1 | −1.4 | −2.7 | −5.7 | 0.9 | −17.5 |
| 262 | Federal
Revised FY 2020 OMB Budget data for 2019 and 2020; new preliminary FY 2021 OMB Budget data for 2020. |
0.0 | 0.1 | 0.0 | −0.7 | −0.4 | −0.6 |
| 263 | State and local
Revised Census Bureau government finances FY 2017–FY 2018 tabulations for 2016–2018; new government finances FY 2019 tabulations for 2018 and 2019. |
−0.1 | −1.5 | −2.8 | −5.0 | 1.2 | −16.8 |
| Addenda: | |||||||
| 264 | Gross national product | −50.1 | −61.1 | −75.2 | −63.9 | −24.5 | 21,116.1 |
| 265 | Gross saving | 23.2 | 40.4 | 98.6 | 167.7 | 190.2 | 4,002.9 |
| 266 | Personal income | −63.8 | −98.4 | −145.8 | −127.1 | −100.3 | 19,627.6 |
| 267 | Compensation of employees | 2.3 | 3.6 | 9.4 | 15.3 | 81.5 | 11,572.2 |
| 268 | Proprietors' income with IVA and CCAdj | −1.5 | −3.2 | −5.5 | −58.8 | −45.1 | 1,650.0 |
| 269 | Rental income of persons with CCAdj | −56.0 | −69.2 | −77.4 | −95.0 | −90.2 | 711.6 |
| 270 | Personal income receipts on assets | −9.1 | −30.6 | −78.4 | 0.1 | −0.7 | 2,912.1 |
| 271 | Personal interest income | −9.1 | −24.2 | −26.6 | −25.4 | −25.8 | 1,614.4 |
| 272 | Monetary interest received by persons | −14.5 | −35.8 | −38.9 | −32.4 | ... | 571.7 |
| 273 | Imputed interest received by persons, depositor, insurance, and pension services | 5.4 | 11.6 | 12.4 | 7.0 | ... | 1,041.6 |
| 274 | From banks, credit agencies, and investment companies | 9.1 | 14.0 | 13.4 | 5.5 | ... | 246.0 |
| 275 | From life insurance carriers | −0.9 | −1.0 | −1.7 | −3.1 | ... | 298.2 |
| 276 | From property and casualty insurance companies | 0.0 | 0.0 | 0.0 | −0.3 | ... | 10.7 |
| 277 | From employee pension plans | −2.7 | −1.5 | 0.7 | 4.8 | ... | 486.6 |
| 278 | Imputed interest received by nonprofit institutions | 0.0 | 0.0 | 0.0 | 0.0 | 0.0 | 1.1 |
| 279 | Personal dividend income | 0.0 | −6.3 | −51.8 | 25.5 | 25.2 | 1,297.8 |
| 280 | Personal current transfer receipts | 0.2 | 1.3 | 6.0 | 13.9 | −27.6 | 4,241.1 |
| 281 | Government social benefits to persons | 0.2 | 1.4 | 3.2 | 5.1 | −40.3 | 4,181.3 |
| 282 | Federal
Revised Centers for Medicare and Medicaid Services data on incurred Medicare benefits for 2016–2019; new data for 2020. New Department of Labor Employment and Training Administration data on UI benefits for 2020. Revised FY 2020 OMB Budget data for 2019 and 2020; new preliminary FY 2021 OMB Budget data for 2020. |
−0.3 | 0.0 | 0.7 | 0.9 | −39.7 | 3,373.0 |
| 283 | State and local | 0.5 | 1.4 | 2.5 | 4.2 | −0.6 | 808.3 |
| 284 | Other current transfer receipts, from business (net) | 0.1 | −0.1 | 2.8 | 8.8 | 12.7 | 59.9 |
| 285 | Less: Contributions for government social insurance, domestic | −0.3 | 0.4 | 0.0 | 2.6 | 18.3 | 1,459.5 |
| 286 | Federal
Social Security Administration data on wages and earnings (2016–2020); QCEW data (2020). |
−0.2 | 0.5 | 0.8 | 4.0 | 18.7 | 1,444.6 |
| 287 | State and local | −0.1 | −0.2 | −0.6 | −1.4 | −0.5 | 19.9 |
| 288 | Less: Personal current taxes | 0.3 | 2.3 | −9.0 | 2.2 | −7.1 | 2,195.6 |
| 289 | Federal
Treasury Department tax receipts and tax refunds data for 2020. |
0.0 | −1.1 | −1.0 | −4.4 | −17.2 | 1,679.6 |
| 290 | State and local
Revised Census Bureau government finances FY 2017–FY 2018 tabulations for 2016–2018; new FY 2019 tabulations for 2018 and 2019; revised FY 2017–FY 2019 Census Bureau state government tax collections tabulations for 2016 and 2019; new FY 2020 tabulations for 2019 and 2020; new Quarterly summary of tax revenue for 2020; revised for 2019. |
0.3 | 3.4 | −8.0 | 6.6 | 10.1 | 515.9 |
| 291 | Equals: Disposable personal income | −64.2 | −100.7 | −136.8 | −129.4 | −93.2 | 17,432.0 |
| 292 | Less: Personal outlays | −77.0 | −106.1 | −90.5 | −135.9 | −103.7 | 14,544.5 |
| 293 | Personal consumption expenditures | −76.7 | −101.2 | −79.8 | −115.9 | −97.8 | 14,047.6 |
| 294 | Personal interest payments | −0.2 | −5.7 | −11.9 | −22.0 | −13.7 | 285.4 |
| 295 | Monetary interest paid by persons
Revised Department of Education data on student loan balances for 2020. |
2.4 | −3.6 | −11.8 | −23.5 | −18.3 | 350.9 |
| 296 | Imputed interest paid by persons, borrower services | −2.7 | −2.2 | −0.1 | 1.5 | 4.5 | −65.4 |
| 297 | Personal current transfer payments | 0.0 | 0.9 | 1.2 | 2.0 | 7.8 | 211.5 |
| 298 | To government | 0.0 | 0.3 | 2.5 | 3.4 | 1.8 | 114.6 |
| 299 | To the rest of the world (net) | 0.0 | 0.5 | −1.3 | −1.4 | 6.0 | 96.9 |
| 300 | Equals: Personal saving | 12.8 | 5.4 | −46.4 | 6.6 | 10.5 | 2,887.5 |
| Line | NIPA component and major source data incorporated1 | Revision in level | Level | ||||
|---|---|---|---|---|---|---|---|
| 2016 | 2017 | 2018 | 2019 | 2020 | 2020 | ||
| 1 | Gross domestic product | −50.0 | −63.4 | −84.7 | −60.6 | −42.8 | 20,893.7 |
| 2 | Personal consumption expenditures | −76.7 | −101.2 | −79.8 | −115.9 | −97.8 | 14,047.6 |
| 3 | Goods | −6.5 | −13.7 | −18.1 | −33.3 | −5.0 | 4,653.8 |
| 4 | Durable goods | −5.0 | −14.0 | −12.4 | −21.1 | −2.5 | 1,616.4 |
| 5 | Motor vehicles and parts
Revised trade source data on new vehicle units for 2016–2020; revised trade source data on new vehicle registrations for 2020. |
−1.2 | −2.3 | −3.8 | −7.3 | 6.0 | 541.3 |
| Of which: | |||||||
| 6 | Net purchases of used motor vehicles
Revised trade source data on cars and trucks in operation for 2016–2019; new Census Bureau Annual Retail Trade Survey (ARTS) data for retail and wholesale margins for 2019; new trade source data on cars and trucks in operation for 2020; revised Census Bureau Monthly Retail Trade Survey (MRTS) and Monthly Wholesale Trade Survey (MWTS) data on retail sales and wholesale sales of used motor vehicle dealers for 2020. Updated Motor Vehicle Retention Rates for 2016–2020, based on trade source data on cars and trucks in operation. |
−0.1 | −1.5 | −3.4 | −7.6 | 3.4 | 167.9 |
| 7 | Furnishings and durable household equipment | −0.9 | −2.0 | 2.2 | 2.8 | 9.8 | 390.4 |
| Of which: | |||||||
| 8 | Furniture and furnishings
Revised ARTS data for 2016–2018; new ARTS data for 2019; revised MRTS data for 2020; Census Ecommerce Report for 2016–2019. |
−0.4 | −1.1 | 3.3 | 3.9 | 6.6 | 245.4 |
| 9 | Recreational goods and vehicles | −2.0 | −7.8 | −7.9 | −12.4 | −14.2 | 476.2 |
| Of which: | |||||||
| 10 | Sports and recreational vehicles
Revised ARTS data for 2016–2018; new ARTS data for 2019; revised MRTS data for 2020. |
−0.4 | −0.5 | −0.7 | −4.5 | −7.8 | 75.1 |
| 11 | Other durable goods | −0.9 | −2.0 | −2.9 | −4.1 | −4.2 | 208.5 |
| 12 | Nondurable goods | −1.5 | 0.3 | −5.8 | −12.2 | −2.4 | 3,037.4 |
| 13 | Food and beverages purchased for off-premises consumption | 0.8 | 2.9 | 1.5 | 5.2 | 12.8 | 1,146.7 |
| Of which: | |||||||
| 14 | Food and nonalcoholic beverages purchased for off-premises consumption
Revised ARTS data for 2016–2018; new ARTS data for 2019; revised MRTS data for 2020; revised trade source retail scanner data for 2019; new trade source retail scanner data for 2020. |
1.5 | 4.0 | 3.0 | 6.3 | 12.9 | 979.3 |
| 15 | Clothing and footwear | −0.7 | 1.0 | −2.2 | −5.3 | 8.8 | 362.4 |
| Of which: | |||||||
| 16 | Garments
Revised ARTS data for 2016–2018; new ARTS data for 2019; revised MRTS data for 2020; revised Census Ecommerce Report for 2016–2018; new Census Ecommerce Report for 2019. |
−0.3 | 1.1 | −0.6 | −1.1 | 8.1 | 279.6 |
| 17 | Gasoline and other energy goods | 0.7 | 0.9 | 1.1 | 2.2 | −2.8 | 246.8 |
| 18 | Other nondurable goods | −2.3 | −4.5 | −6.2 | −14.3 | −21.3 | 1,281.5 |
| Of which: | |||||||
| 19 | Pharmaceutical and other medical products
Revised trade source data on prescription drug sales for 2019–2020. |
−0.4 | −0.3 | −0.2 | −4.5 | −5.8 | 576.7 |
| 20 | Recreational items
Revised ARTS data for 2016–2018; new ARTS data for 2019; revised MRTS data for 2020; Census Ecommerce Report for 2016–2019. |
−0.6 | −2.8 | −4.0 | −5.7 | −13.7 | 190.7 |
| Line | NIPA component and major source data incorporated1 | Revision in level | Level | ||||
|---|---|---|---|---|---|---|---|
| 2016 | 2017 | 2018 | 2019 | 2020 | 2020 | ||
| 21 | Services | −70.2 | −87.5 | −61.6 | −82.6 | −92.8 | 9,393.7 |
| 22 | Household consumption expenditures (for services) | −70.9 | −88.8 | −67.5 | −83.4 | −92.6 | 8,872.9 |
| 23 | Housing and utilities | −77.6 | −96.3 | −98.1 | −109.7 | −116.1 | 2,668.1 |
| 24 | Housing | −77.6 | −95.7 | −101.1 | −108.1 | −110.6 | 2,315.7 |
| Of which: | |||||||
| 25 | Rental of tenant-occupied nonfarm housing
Revisions for 2002 through 2020 reflect new methodology for Housing output. Newly incorporated American Community Survey (ACS) data for 2005–2019; BEA projections for 2020; new Freddie Mac data on mortgage originations for 2020; new Federal Reserve Board (FRB) data on mortgage debt outstanding for 2020; new A.M. Best Co. data on property insurance for 2019. |
−75.2 | −86.8 | −80.1 | −84.3 | −88.7 | 559.0 |
| 26 | Imputed rental of owner-occupied nonfarm housing
Revisions for 2002 through 2020 reflect new methodology for Housing output. Newly incorporated American Community Survey (ACS) data for 2005–2019; BEA projections for 2020; new Freddie Mac data on mortgage originations for 2020; new Federal Reserve Board (FRB) data on mortgage debt outstanding for 2020; new A.M. Best Co. data on property insurance for 2019. |
−5.6 | −12.0 | −24.2 | −26.2 | −24.4 | 1,731.7 |
| 27 | Household utilities | 0.0 | −0.7 | 3.0 | −1.6 | −5.5 | 352.5 |
| Of which: | |||||||
| 28 | Electricity and gas | −0.1 | −1.3 | 2.4 | −2.5 | −6.4 | 240.1 |
| Of which: | |||||||
| 29 | Electricity | −0.5 | −1.4 | 0.1 | −3.6 | −5.1 | 189.7 |
| 30 | Health care | −5.7 | −9.5 | −5.4 | 7.3 | 0.5 | 2,308.4 |
| 31 | Outpatient services | 4.9 | 9.3 | 10.2 | 26.4 | 24.6 | 1,064.4 |
| Of which: | |||||||
| 32 | Physician services
Revised Service Annual Survey (SAS) taxable and tax-exempt revenue data for 2016 through 2019; revised QSS data for 2020. |
3.2 | 5.7 | 4.9 | 14.0 | 13.3 | 552.0 |
| 33 | Paramedical services
Revised SAS taxable revenue data for 2016 through 2019; revised QSS data for 2020. |
1.3 | 2.7 | 3.2 | 7.5 | 7.5 | 401.9 |
| 34 | Hospital and nursing home services | −10.6 | −18.8 | −15.6 | −19.1 | −24.1 | 1,244.0 |
| Of which: | |||||||
| 35 | Hospitals
Revised SAS taxable and tax-exempt revenue data for 2016 through 2019; revised QSS data for 2020. |
−10.2 | −17.6 | −15.7 | −23.2 | −20.2 | 1,061.4 |
| 36 | Transportation services | 0.3 | 0.6 | 2.7 | 11.9 | −3.3 | 363.4 |
| 37 | Motor vehicle services | 0.1 | 0.3 | −0.6 | 4.9 | 11.1 | 282.3 |
| Of which: | |||||||
| 38 | Motor vehicle maintenance and repair
Revised SAS taxable revenue and ARTS data for 2016 through 2019; Revised QSS for 2020. |
−0.1 | 0.3 | 0.1 | 4.6 | 8.2 | 183.3 |
| 39 | Public transportation | 0.2 | 0.3 | 3.3 | 7.0 | −14.3 | 81.2 |
| Of which: | |||||||
| 40 | Air transportation
Revised SAS taxable revenue data for 2016 through 2019; new Bureau of Transportation Statistics data for 2020. |
0.0 | 0.1 | 0.1 | 5.7 | −11.9 | 49.6 |
| 41 | Recreation services | 0.4 | 3.7 | 2.9 | 2.8 | 11.3 | 416.5 |
| Of which: | |||||||
| 42 | Gambling | −1.0 | −1.3 | −1.2 | −5.3 | 5.1 | 110.1 |
| 43 | Food services and accommodations | 0.0 | −0.2 | −0.4 | 8.8 | 5.8 | 801.5 |
| Of which: | |||||||
| 44 | Food services | 0.0 | −0.6 | −2.0 | 7.6 | 5.2 | 723.3 |
| Of which: | |||||||
| 45 | Purchased meals and beverages
Revised SAS taxable revenue data for 2016 through 2019; revised MRTS for 2020. |
0.0 | −0.6 | −2.0 | 7.5 | 5.5 | 703.6 |
| Line | NIPA component and major source data incorporated1 | Revision in level | Level | ||||
|---|---|---|---|---|---|---|---|
| 2016 | 2017 | 2018 | 2019 | 2020 | 2020 | ||
| 46 | Financial services and insurance | 12.2 | 16.6 | 32.4 | −4.5 | −11.1 | 1,196.3 |
| 47 | Financial services | 11.6 | 15.8 | 19.5 | 7.3 | 10.0 | 756.4 |
| 48 | Financial services furnished without payment
Revised Federal Reserve Board (FRB) financial accounts of the United States data for 2016 to 2019; new FRB data for 2020; revised Internal Revenue Service (IRS) tabulations of corporate tax return data for 2018; new IRS tabulations of corporate and of sole proprietorship and partnership tax return data for 2019; new Federal Deposit Insurance Corporation (FDIC) data for 2020; new trade source data on credit unions and on investment companies for 2020. |
11.7 | 16.2 | 15.1 | 5.4 | −4.3 | 376.4 |
| 49 | Financial service charges, fees, and commissions
Revised SAS revenue data for 2016 through 2019; revised QSS data for 2020. |
−0.2 | −0.4 | 4.4 | 1.9 | 14.4 | 380.0 |
| 50 | Insurance | 0.6 | 0.8 | 12.9 | −11.8 | −21.1 | 439.9 |
| Of which: | |||||||
| 51 | Life insurance
Revised and newly available trade source data on life insurance company expenses for 2018 and 2019; new BLS Quarterly Census of Employment and Wages (QCEW) data for 2020. |
0.6 | 0.8 | 0.5 | −7.3 | −11.3 | 93.5 |
| 52 | Net health insurance
Revised benefits-to-premiums ratio based on trade source data on medical insurance for 2019; new Medical Expenditure Panel Survey data for 2019. BEA projections for 2020. |
0.0 | 0.0 | 12.4 | −1.1 | −4.5 | 252.5 |
| 53 | Net motor vehicle and other transportation insurance
Revised premium and loss data for 2018, newly available data for 2019 - 2020 from A.M. Best Co. |
0.0 | 0.0 | 0.0 | −3.6 | −5.7 | 82.4 |
| 54 | Other services | −0.4 | −3.6 | −1.5 | 0.0 | 20.3 | 1,118.5 |
| Of which: | |||||||
| 55 | Professional and other services | −0.6 | −1.6 | −1.5 | 0.9 | 6.4 | 198.5 |
| 56 | Net foreign travel2 | 0.5 | −1.9 | −0.5 | −1.9 | 7.9 | −20.6 |
| Of which: | |||||||
| 57 | Less: Expenditures in the United States by nonresidents
Revised Bureau of Economic Analysis (BEA) international transactions accounts (ITAs) data for 2016–2020. |
0.0 | 2.6 | 4.3 | 6.0 | −3.9 | 74.6 |
| 58 | Final consumption expenditures of NPISH | 0.7 | 1.2 | 5.9 | 0.7 | −0.2 | 520.9 |
| 59 | Gross output of nonprofit institutions
Revised SAS tax-exempt expenses data for 2016 through 2019; revised Census Bureau Quarterly Services Survey (QSS) data for 2020. |
−6.2 | −13.1 | −9.2 | −14.5 | −8.3 | 1,644.8 |
| 60 | Less: Receipts from sales of goods and services by nonprofit institutions
Revised SAS revenue data for 2016 through 2019; revised QSS data for 2020. |
−6.9 | −14.4 | −15.1 | −15.2 | −8.2 | 1,123.9 |
| Line | NIPA component and major source data incorporated1 | Revision in level | Level | ||||
|---|---|---|---|---|---|---|---|
| 2016 | 2017 | 2018 | 2019 | 2020 | 2020 | ||
| 61 | Gross private domestic investment | 16.7 | 30.2 | 4.9 | 75.0 | 33.1 | 3,637.8 |
| 62 | Fixed investment | 8.8 | 17.1 | 3.9 | 50.5 | 19.8 | 3,697.4 |
| 63 | Nonresidential | 8.8 | 17.1 | 3.9 | 43.7 | 7.3 | 2,799.6 |
| 64 | Structures | 0.1 | 0.2 | 1.9 | 22.4 | 12.5 | 597.2 |
| 65 | Commercial and health care
Revised Census Bureau construction spending (value-put-in-place) data for 2019–2020. |
0.0 | 0.0 | 0.0 | 7.6 | 8.5 | 204.7 |
| Of which: | |||||||
| 66 | Office | 0.0 | 0.0 | 0.0 | 4.1 | 6.0 | 86.5 |
| 67 | Power and communication | 0.0 | 0.0 | 0.0 | 3.3 | −5.0 | 130.3 |
| Of which: | |||||||
| 68 | Power
Revised Census Bureau construction spending (value-put-in-place) data for 2019–2020. |
0.0 | 0.0 | 0.0 | 3.3 | −4.9 | 107.9 |
| Of which: | |||||||
| 69 | Other power | 0.0 | 0.0 | 0.0 | 1.4 | −8.6 | 25.1 |
| 70 | Mining exploration, shafts, and wells | 0.1 | 0.1 | 1.6 | 6.7 | 2.6 | 75.6 |
| 71 | Other structures
Revised Census Bureau construction spending (value-put-in-place) data for 2019–2020. |
0.0 | 0.1 | 0.3 | 4.1 | 5.1 | 117.2 |
| 72 | Equipment | −0.8 | −4.9 | −22.9 | −9.6 | −52.9 | 1,123.9 |
| 73 | Information processing equipment | −0.2 | −2.1 | −5.7 | −3.4 | −5.9 | 413.9 |
| Of which: | |||||||
| 74 | Computers and peripheral equipment
For 2020, revision to capitalized systems integration services based on Census Bureau QSS revenue data. |
0.4 | −1.4 | 0.0 | −2.5 | −9.1 | 128.1 |
| 75 | Communication equipment
For 2019, new Census Bureau Annual Survey of Manufacturers (ASM) data; revised Census Bureau monthly industry shipments data for 2020. |
−0.2 | −1.5 | 1.4 | 4.5 | 5.0 | 122.0 |
| 76 | Industrial equipment | −0.3 | −2.9 | −8.8 | −9.0 | −10.3 | 241.7 |
| 77 | Transportation equipment | 0.3 | 2.0 | 0.0 | 10.0 | −35.1 | 206.0 |
| Of which: | |||||||
| 78 | Trucks, buses, and truck trailers | −2.3 | 1.2 | 4.7 | 4.8 | −28.0 | 150.7 |
| Of which: | |||||||
| 79 | Light trucks (including utility vehicles)
For 2016–2019, revised motor vehicle in operation data and revised motor vehicle retention rates from trade source; for 2020, new motor vehicle in operation data from trade source. |
−2.2 | −0.5 | 1.1 | 3.0 | −27.2 | 104.3 |
| 80 | Autos
For 2016–2019, revised motor vehicle in operation data and revised motor vehicle retention rates from trade source; for 2020, new motor vehicle in operation data from trade source. |
1.1 | 1.6 | 2.4 | 3.9 | −8.6 | 8.0 |
| 81 | Aircraft
For 2018, revised Census Bureau ASM data; for 2019, new Census Bureau ASM data. Revised Census Bureau monthly industry shipments data for 2020. |
−0.1 | 1.0 | −7.6 | 3.1 | 5.5 | 31.2 |
| 82 | Other equipment | −0.5 | −0.2 | −8.8 | −8.7 | −4.9 | 268.3 |
| Of which: | |||||||
| 83 | Agricultural machinery
For 2018, revised Census Bureau ASM data; for 2019, new Census Bureau ASM data. Revised Census Bureau monthly industry shipments data for 2020. |
−0.1 | 1.2 | −6.1 | −5.4 | −3.5 | 42.3 |
| 84 | Other
For 2018, revised Census Bureau ASM data; for 2019, new Census Bureau ASM data. Revised Census Bureau monthly industry shipments data for 2020. |
−0.5 | 0.7 | 2.5 | 1.9 | 5.5 | 72.3 |
| Line | NIPA component and major source data incorporated1 | Revision in level | Level | ||||
|---|---|---|---|---|---|---|---|
| 2016 | 2017 | 2018 | 2019 | 2020 | 2020 | ||
| 85 | Intellectual property products | 9.6 | 21.8 | 24.9 | 30.9 | 47.6 | 1,078.5 |
| 86 | Software | 7.5 | 16.5 | 18.6 | 16.5 | 23.9 | 453.4 |
| Of which: | |||||||
| 87 | Prepackaged
Revised Census Bureau SAS revenue data for 2016–2019; revised QSS revenue data for 2020. |
4.5 | 9.4 | 10.3 | 11.0 | 14.2 | 212.5 |
| 88 | Custom
Revised Census Bureau SAS revenue data for 2016–2019; revised QSS revenue data for 2020. |
3.1 | 7.1 | 8.3 | 5.6 | 7.5 | 165.5 |
| 89 | Research and development
New National Science Foundation (NSF) business enterprise research and development survey data (BERD) for 2019; revised service annual survey (SAS) data on expenses and receipts of tax-exempt scientific research and development services establishments for 2016–2019; revised public financial reports on research and development (R&D) expenses data and revised QSS revenue data for 2020. |
1.1 | 3.6 | 4.3 | 12.5 | 21.4 | 537.7 |
| Of which: | |||||||
| 90 | Business | 1.1 | 3.3 | 3.3 | 13.3 | 21.2 | 511.0 |
| Of which: | |||||||
| 91 | Nonmanufacturing | 1.7 | 4.0 | 6.2 | 17.8 | 20.3 | 215.3 |
| Of which: | |||||||
| 92 | All other nonmanufacturing | 1.6 | 3.8 | 5.9 | 16.1 | 20.0 | 204.5 |
| 93 | Entertainment, literary, and artistic originals | 1.0 | 1.8 | 2.0 | 1.9 | 2.3 | 87.4 |
| 94 | Residential | 0.0 | −0.1 | 0.0 | 6.8 | 12.6 | 897.8 |
| 95 | Structures | 0.0 | 0.0 | 0.1 | 6.9 | 12.7 | 883.4 |
| 96 | Permanent site | 0.0 | 0.0 | 0.0 | 1.8 | 8.5 | 381.9 |
| Of which: | |||||||
| 97 | Single-family structures
Revised Census Bureau construction spending (value-put-in-place) data for 2020. |
0.0 | 0.0 | 0.0 | 0.0 | 7.6 | 309.4 |
| 98 | Other structures | 0.0 | 0.0 | 0.1 | 5.1 | 4.1 | 501.5 |
| 99 | Residential equipment | −0.1 | −0.1 | −0.1 | −0.1 | −0.1 | 14.3 |
| Line | NIPA component and major source data incorporated1 | Revision in level | Level | ||||
|---|---|---|---|---|---|---|---|
| 2016 | 2017 | 2018 | 2019 | 2020 | 2020 | ||
| 100 | Change in private inventories | 7.9 | 13.2 | 1.0 | 24.5 | 13.2 | −59.6 |
| 101 | Farm
Revised U.S. Department of Agriculture (USDA) data for 2016–2020 |
0.0 | 0.0 | −1.2 | −0.7 | −7.1 | −6.0 |
| 102 | Nonfarm
Revised Annual Wholesale Trade Survey (AWTS) data (2016); revised Economic Census, AWTS, and ARTS data (2017); revised ASM data (2018); new ASM data (2019); revised Census Bureau monthly inventory data and BEA wages (2020). |
7.9 | 13.2 | 2.1 | 25.3 | 20.3 | −53.6 |
| 103 | Change in book value
Revised AWTS data for 2016 and 2017; revised and new ASM data for 2018 and 2019; revised Census Bureau monthly inventory data for 2020. |
5.9 | 3.9 | −9.4 | 19.6 | 14.2 | −34.6 |
| 104 | Mining, utilities, and construction
Revised Census Bureau Quarterly Financial Report (QFR) and Statistics of Income (SOI) data for 2019. |
0.0 | 0.0 | 0.4 | 7.6 | 0.6 | −0.8 |
| 105 | Manufacturing
Revised ASM data for 2016 and 2018; revised Economic Census data for 2017;New ASM data for 2019; revised Census Bureau monthly inventory data for 2020. |
−2.1 | −3.2 | −3.2 | 14.4 | 1.4 | −3.1 |
| 106 | Wholesale trade
Revised and newly available AWTS data for 2016–2019; revised Census Bureau monthly inventory data for 2020. |
7.7 | 9.0 | −1.1 | 6.8 | 4.0 | −12.6 |
| 107 | Merchant wholesale | 3.7 | 3.8 | −1.3 | 3.6 | 3.4 | −7.1 |
| 108 | Nonmerchant wholesale
Revised and newly available AWTS data for 2016–2019; revised Census Bureau monthly inventory data for 2020. |
4.0 | 5.1 | 0.2 | 3.2 | 0.6 | −5.4 |
| 109 | Retail trade
Newly available ARTS data for 2019; revised Census Bureau monthly inventory data for 2020. |
−0.5 | −1.7 | −2.1 | −4.4 | 13.0 | −13.4 |
| 110 | Retail motor vehicle dealers
Revised and newly available ARTS data and revised unit-based motor vehicles data for 2016–2020; revised Census Bureau monthly inventory data for 2020. |
0.2 | −0.4 | −1.0 | −3.6 | 11.8 | −17.8 |
| 111 | Other industries
New SAS and SOI data for 2018–2019; revised QFR data for 2019; revised BEA wage data for 2020. |
0.7 | −0.2 | −3.5 | −4.8 | −4.9 | −4.7 |
| 112 | Inventory valuation adjustment (IVA)
Revised and newly available SOI data (2016); revised ARTS data (2017); Revised 2018 ASM data and newly available 2019 ASM data; newly available AWTS LIFO data (2019). |
2.1 | 9.3 | 11.6 | 6.3 | 6.1 | −19.0 |
| 113 | Net exports of goods and services2
Revised ITA data for 1999–2020. |
6.3 | 15.6 | 13.3 | 14.2 | −6.4 | −651.2 |
| 114 | Exports of goods and services | 4.9 | 9.2 | 4.8 | 5.0 | −3.7 | 2,123.4 |
| 115 | Exports of goods | 3.6 | 4.9 | 5.4 | 5.0 | −1.4 | 1,416.6 |
| Of which: | |||||||
| 116 | Other
New data source (Census Bureau data on trade in goods) for the territorial adjustment (1999–2020). |
3.6 | 4.9 | 5.5 | 5.5 | 4.1 | 64.5 |
| 117 | Exports of services | 1.4 | 4.3 | −0.6 | 0.0 | −2.4 | 706.8 |
| 118 | Imports of goods and services | −1.3 | −6.4 | −8.5 | −9.2 | 2.6 | 2,774.6 |
| 119 | Imports of goods | −2.4 | −7.0 | −6.5 | −7.7 | 0.6 | 2,309.2 |
| Of which: | |||||||
| 120 | Other
New data source (Census Bureau data on trade in goods) for the territorial adjustment (1999–2020). |
−2.4 | −7.0 | −4.4 | −4.3 | −4.8 | 128.4 |
| 121 | Imports of services | 1.1 | 0.6 | −2.0 | −1.5 | 2.0 | 465.4 |
| Of which: | |||||||
| 122 | Transport | 0.0 | 0.0 | 4.1 | 5.3 | 4.4 | 72.4 |
| 123 | Other business services | 6.9 | 9.0 | 6.0 | 7.0 | 5.9 | 284.5 |
| 124 | Other | −5.9 | −8.4 | −11.0 | −11.4 | −6.7 | 5.1 |
| Line | NIPA component and major source data incorporated1 | Revision in level | Level | ||||
|---|---|---|---|---|---|---|---|
| 2016 | 2017 | 2018 | 2019 | 2020 | 2020 | ||
| 125 | Government consumption expenditures and gross investment | 3.8 | −8.0 | −23.1 | −34.0 | 28.2 | 3,859.5 |
| 126 | Federal government | −0.2 | −1.1 | −0.5 | −4.2 | 17.3 | 1,501.8 |
| 127 | Consumption expenditures
Revised allocations of FY 2018 and FY 2019 Office of Management and Budget (OMB) Budget data for 2018 and 2019; revised FY 2020 OMB Budget data for 2019 and 2020; new preliminary FY 2021 OMB Budget data for 2020. |
−0.9 | −2.4 | −4.1 | 0.1 | 18.9 | 1,161.4 |
| Of which: | |||||||
| 128 | Compensation of general government employees | 0.4 | 0.2 | 0.2 | 0.0 | 7.8 | 488.6 |
| 129 | Services
Revised allocations of FY 2018 and FY 2019 Office of Management and Budget (OMB) Budget data for 2018 and 2019; revised FY 2020 OMB Budget data for 2019 and 2020; new preliminary FY 2021 OMB Budget data for 2020. |
−0.3 | −1.9 | −1.6 | 3.6 | 9.8 | 332.2 |
| 130 | Gross investment | 0.7 | 1.3 | 3.6 | −4.3 | −1.6 | 340.3 |
| Of which: | |||||||
| 131 | Intellectual property products | 0.7 | 1.1 | 3.9 | −4.9 | −5.2 | 195.0 |
| Of which: | |||||||
| 132 | Research and development | 0.0 | −0.5 | 2.1 | −6.3 | −6.7 | 152.4 |
| 133 | National defense
Revised allocations of FY 2018 and FY 2019 Office of Management and Budget (OMB) Budget data for 2018 and 2019; revised FY 2020 OMB Budget data for 2019 and 2020; new preliminary FY 2021 OMB Budget data for 2020. |
−0.8 | −0.7 | −1.6 | −4.9 | −4.3 | 881.3 |
| 134 | Nondefense
Revised allocations of FY 2018 and FY 2019 Office of Management and Budget (OMB) Budget data for 2018 and 2019; revised FY 2020 OMB Budget data for 2019 and 2020; new preliminary FY 2021 OMB Budget data for 2020. |
0.6 | −0.4 | 1.1 | 0.6 | 21.6 | 620.5 |
| 135 | Consumption expenditures
Revised allocations of FY 2018 and FY 2019 Office of Management and Budget (OMB) Budget data for 2018 and 2019; revised FY 2020 OMB Budget data for 2019 and 2020; new preliminary FY 2021 OMB Budget data for 2020. |
0.1 | −2.0 | −5.5 | −3.9 | 16.3 | 461.0 |
| Of which: | |||||||
| 136 | Compensation of general government employees | 0.2 | 0.1 | 0.2 | 0.3 | 4.8 | 208.5 |
| 137 | Services
Revised allocations of FY 2018 and FY 2019 Office of Management and Budget (OMB) Budget data for 2018 and 2019; revised FY 2020 OMB Budget data for 2019 and 2020; new preliminary FY 2021 OMB Budget data for 2020. |
0.3 | −0.9 | −3.5 | −2.2 | 8.1 | 119.9 |
| 138 | Gross investment | 0.5 | 1.7 | 6.6 | 4.5 | 5.3 | 159.5 |
| Of which: | |||||||
| 139 | Intellectual property products | 0.5 | 1.7 | 7.0 | 4.1 | 2.5 | 121.3 |
| Of which: | |||||||
| 140 | Research and development
Revised BLS QCEW data for 2016–2019. New QCEW for 2020. |
0.0 | 0.6 | 5.8 | 3.2 | 1.4 | 92.2 |
| 141 | State and local | 4.0 | −6.9 | −22.7 | −29.7 | 10.9 | 2,357.8 |
| 142 | Consumption expenditures | 3.2 | −9.6 | −17.8 | −21.3 | 22.1 | 1,916.5 |
| Of which: | |||||||
| 143 | Compensation of general government employees
Revised BLS QCEW data for 2016–2019. New QCEW for 2020. |
−0.4 | 0.1 | −0.8 | −10.1 | 32.2 | 1,459.8 |
| 144 | Services
Revised Census Bureau government finances FY 2017–FY 2018 tabulations for 2016–2018; new government finances FY 2019 tabulations for 2018 and 2019. |
−1.0 | −9.2 | −11.3 | −9.2 | −11.3 | 495.2 |
| 145 | Less: Sales to other sectors
Revised Census Bureau government finances FY 2017–FY 2018 tabulations for 2016–2018; new government finances FY 2019 tabulations for 2018 and 2019. |
−4.6 | −3.1 | 2.1 | −0.4 | −5.4 | 493.9 |
| Of which: | |||||||
| 146 | Tuition and related educational charges | −0.1 | −0.3 | −1.3 | −1.8 | −6.0 | 97.4 |
| 147 | Health and hospital charges | −4.0 | −2.6 | 1.6 | −0.3 | 5.0 | 250.9 |
| 148 | Gross investment | 0.8 | 2.7 | −4.9 | −8.5 | −11.2 | 441.2 |
| Of which: | |||||||
| 149 | Structures
Revised Census Bureau government finances FY 2017–FY 2018 tabulations for 2016– new government finances FY 2019 tabulations for 2018 and 2019. |
0.7 | 2.6 | −4.7 | −8.1 | −13.6 | 345.5 |
| Line | NIPA component and major source data incorporated1 | Revision in level | Level | ||||
|---|---|---|---|---|---|---|---|
| 2016 | 2017 | 2018 | 2019 | 2020 | 2020 | ||
| 150 | Gross domestic product | −50.0 | −63.4 | −84.7 | −60.6 | −42.8 | 20,893.7 |
| 151 | Less: Statistical discrepancy3 | −1.2 | 12.5 | −67.5 | −82.5 | −143.5 | −170.6 |
| 152 | Equals: Gross domestic income | −48.7 | −75.9 | −17.3 | 21.8 | 100.7 | 21,064.3 |
| 153 | Compensation of employees, paid
See entries for components under Compensation of employees, line 267, and additional source data below. |
2.3 | 3.7 | 9.2 | 15.0 | 79.0 | 11,580.1 |
| 154 | Wages and salaries | 2.1 | 3.3 | 6.1 | 13.9 | 71.2 | 9,452.0 |
| 155 | To persons
Revised QCEW data for 2016 through 2020; new IRS exact match data on nonfilers for 2019; new Census data on wages paid to tipped employees for 2020; new Bureau of Labor Statistics (BLS) data on wages not covered by the QCEW program for 2020. |
2.1 | 3.2 | 6.0 | 13.8 | 73.4 | 9,437.6 |
| 156 | To the rest of the world | 0.0 | 0.1 | 0.1 | 0.1 | −2.3 | 14.4 |
| 157 | Supplements to wages and salaries | 0.1 | 0.4 | 3.1 | 1.1 | 7.9 | 2,128.0 |
| 158 | Taxes on production and imports
FY 2017–FY 2019 Census Bureau Annual State Tax Collection Survey (STC) data, preliminary FY 2020 STC data, and a FY 2021 extrapolation. FY 2017–FY 2018 Census Bureau Local Government Finance Data, preliminary FY 2019 data. |
−0.1 | 2.3 | 17.0 | 40.9 | 53.0 | 1,534.7 |
| 159 | Less: Subsidies
FY 2022 federal budget |
0.0 | 0.0 | 0.0 | −0.9 | 15.0 | 761.4 |
| 160 | Net operating surplus | −51.3 | −87.2 | −51.9 | −49.6 | −33.1 | 5,135.0 |
| 161 | Private enterprises | −51.2 | −85.8 | −49.1 | −43.9 | −34.0 | 5,152.5 |
| 162 | Current surplus of government enterprises
Revised Census Bureau government finances FY 2017–FY 2018 tabulations for 2016–2018; new government finances FY 2019 tabulations for 2018 and 2019. |
−0.1 | −1.4 | −2.7 | −5.7 | 0.9 | −17.5 |
| 163 | Consumption of fixed capital | 0.5 | 5.3 | 8.4 | 14.6 | 16.8 | 3,575.9 |
| 164 | Private | 1.6 | 6.4 | 9.1 | 16.0 | 18.6 | 2,969.6 |
| 165 | Domestic business
Revised BEA fixed investment and price estimates for 2015–2019. |
1.4 | 5.8 | 8.3 | 14.7 | 16.4 | 2,338.6 |
| 166 | Capital consumption allowances
Revised IRS tabulations of corporate tax return data for 2017; new IRS tabulations of corporate and of sole proprietorship and partnership tax return data for 2018; revised Office of Tax Analysis bonus depreciation estimates for 2015–2019; revised BEA fixed investment estimates for 2015–2019. |
0.9 | 1.2 | −11.8 | 125.9 | 120.8 | 2,754.7 |
| 167 | Less: Capital consumption adjustment (CCAdj) | −0.6 | −4.7 | −20.0 | 111.2 | 104.4 | 416.1 |
| 168 | Households and institutions | 0.1 | 0.6 | 0.8 | 1.3 | 2.2 | 631.0 |
| 169 | Government | −1.1 | −1.1 | −0.7 | −1.3 | −1.8 | 606.4 |
| 170 | Plus: Income receipts from the rest of the world
Revised ITA data for 1999–2020. |
0.0 | 0.0 | −0.8 | −9.5 | 19.1 | 992.9 |
| 171 | Less: Income payments to the rest of the world
Revised ITA data for 1999–2020. |
0.1 | −2.3 | −10.2 | −6.3 | 0.9 | 770.6 |
| 172 | Equals: Gross national income | −48.8 | −73.6 | −7.8 | 18.6 | 119.0 | 21,286.6 |
| 173 | Less: Consumption of fixed capital | 0.5 | 5.3 | 8.4 | 14.6 | 16.8 | 3,575.9 |
| Line | NIPA component and major source data incorporated1 | Revision in level | Level | ||||
|---|---|---|---|---|---|---|---|
| 2016 | 2017 | 2018 | 2019 | 2020 | 2020 | ||
| 174 | Equals: National income | −49.3 | −78.9 | −16.2 | 4.0 | 102.2 | 17,710.7 |
| 175 | Compensation of employees
See entries for components under Compensation of employees, line 267, and additional source data below. |
2.3 | 3.6 | 9.4 | 15.3 | 81.5 | 11,572.2 |
| 176 | Wages and salaries | 2.1 | 3.2 | 6.3 | 14.2 | 73.6 | 9,444.1 |
| 177 | Government
Revised QCEW data for 2016 through 2019; new QCEW data for 2020; revised FY 2020 OMB Budget data for 2019 and 2020; new preliminary FY 2021 OMB Budget data for 2020. |
−0.2 | 0.2 | −1.1 | −0.6 | 49.0 | 1,494.5 |
| 178 | Other | 2.3 | 3.0 | 7.4 | 14.8 | 24.6 | 7,949.6 |
| 179 | Supplements to wages and salaries | 0.1 | 0.4 | 3.1 | 1.1 | 7.9 | 2,128.0 |
| 180 | Employer contributions for employee pension and insurance funds
New Department of Labor pension data for 2018 and 2019; revised Pension Benefit Guaranty Corporation (PBGC) data for 2018; new PBGC data for 2019; revised FRB Financial Accounts of the United States data for 2018 and 2019; new FRB data for 2020; new Department of Health and Human Services medical expenditure panel survey data for 2019 and 2020. |
0.4 | 0.5 | 3.6 | 0.6 | 7.3 | 1,464.4 |
| 181 | Employer contributions for government social insurance | −0.3 | −0.1 | −0.5 | 0.5 | 0.5 | 663.7 |
| 182 | Proprietors' income with IVA and CCAdj
Revised U.S. Department of Agriculture (USDA) data for 2016–2020. |
−1.5 | −3.2 | −5.5 | −58.8 | −45.1 | 1,650.0 |
| 183 | Farm | −2.0 | −2.1 | −4.1 | −11.2 | 5.5 | 70.2 |
| 184 | Proprietors' income with IVA | −2.0 | −2.1 | −4.1 | −11.2 | 5.6 | 76.9 |
| 185 | Capital consumption adjustment | 0.0 | 0.0 | 0.0 | 0.0 | −0.1 | −6.7 |
| 186 | Nonfarm | 0.5 | −1.1 | −1.4 | −47.6 | −50.6 | 1,579.9 |
| 187 | Proprietors' income
Revised IRS tabulations of corporate tax return data for the posttabulation adjustments for 2018; new IRS tabulations of sole proprietorship and partnership tax return data for 2019; new Census Bureau nonfiler income data for 2019. |
−0.2 | −0.3 | 0.3 | −64.3 | −58.6 | 1,214.8 |
| 188 | IVA | 0.8 | 0.8 | 1.0 | 0.2 | −0.3 | −3.4 |
| 189 | CCAdj | −0.1 | −1.6 | −2.7 | 16.5 | 8.3 | 368.4 |
| 190 | Rental income of persons with CCAdj | −56.0 | −69.2 | −77.4 | −95.0 | −90.2 | 711.6 |
| 191 | Rental income of persons
Revisions for 2002 through 2020 reflect new methodology for Housing output. Newly incorporated American Community Survey (ACS) data for 2005–2019; BEA projections for 2020; new census of governments property tax data for 2019; new Freddie Mac data on mortgage originations for 2020; new Federal Reserve Board (FRB) data on mortgage debt outstanding for 2020; new A.M. Best Corporation data on property insurance for 2019. |
−56.0 | −69.2 | −77.4 | −95.0 | −90.4 | 735.1 |
| 192 | Capital consumption adjustment | 0.0 | 0.0 | 0.0 | 0.0 | 0.2 | −23.5 |
| 193 | Corporate profits with IVA and CCAdj
Revised IRS tabulations of corporate tax return data for 2018; new IRS tabulations for 2019; revised Census Bureau QFR data for 2020; regulatory agency and public financial reports profits data for 2020. |
14.0 | 14.4 | 62.0 | 117.3 | 123.5 | 2,243.8 |
| 194 | Domestic industries | 14.0 | 12.7 | 52.8 | 109.3 | 100.2 | 1,789.0 |
| 195 | Financial | 1.5 | −0.9 | 25.5 | 44.9 | 5.5 | 467.0 |
| 196 | Nonfinancial | 12.5 | 13.6 | 27.3 | 64.5 | 94.7 | 1,322.0 |
| 197 | Rest of the world
Revised BEA international transactions accounts estimates for 2016–2020. |
0.0 | 1.7 | 9.2 | 8.0 | 23.3 | 454.7 |
| 198 | Less: CCAdj
See entries under Consumption of fixed capital, line 163. |
−0.5 | −3.0 | −17.3 | 94.7 | 95.9 | 77.9 |
| Line | NIPA component and major source data incorporated1 | Revision in level | Level | ||||
|---|---|---|---|---|---|---|---|
| 2016 | 2017 | 2018 | 2019 | 2020 | 2020 | ||
| 199 | Equals: Corporate profits with IVA | 14.4 | 17.4 | 79.3 | 22.6 | 27.6 | 2,165.9 |
| 200 | Domestic industries | 14.5 | 15.7 | 70.1 | 14.6 | 4.3 | 1,711.2 |
| 201 | Financial | 1.6 | 0.1 | 32.1 | 62.7 | 27.2 | 502.5 |
| 202 | Federal Reserve banks | 0.0 | 0.0 | 0.0 | 11.7 | 12.3 | 92.9 |
| 203 | Other financial | 1.6 | 0.1 | 32.1 | 50.9 | 14.9 | 409.6 |
| 204 | Nonfinancial | 12.9 | 15.6 | 38.0 | −48.0 | −22.9 | 1,208.7 |
| 205 | Utilities | 0.0 | 0.0 | 0.3 | −19.5 | −17.0 | 10.4 |
| 206 | Manufacturing | 4.1 | 12.0 | 9.0 | 19.2 | 44.2 | 328.8 |
| 207 | Durable goods | 2.2 | 5.8 | 7.4 | 2.1 | 27.2 | 188.5 |
| 208 | Nondurable goods | 1.9 | 6.2 | 1.6 | 17.1 | 17.0 | 140.4 |
| 209 | Wholesale trade | 1.3 | 1.2 | 8.7 | 6.5 | 15.0 | 123.7 |
| 210 | Retail trade | 4.7 | 0.5 | 1.6 | −8.9 | 3.5 | 218.5 |
| 211 | Transportation and warehousing | 0.7 | 0.7 | −4.2 | −18.8 | −12.0 | 19.2 |
| 212 | Information | 0.4 | 1.0 | 1.1 | −3.0 | 4.5 | 134.9 |
| 213 | Other nonfinancial | 1.8 | 0.1 | 21.4 | −23.5 | −61.1 | 373.1 |
| 214 | Rest of the world | 0.0 | 1.7 | 9.2 | 8.0 | 23.3 | 454.7 |
| 215 | Less: IVA | 5.2 | 5.8 | 7.0 | 5.3 | 3.5 | −18.2 |
| 216 | Equals: Corporate profits before tax without IVA and CCAdj | 9.2 | 11.5 | 72.3 | 17.3 | 24.1 | 2,184.1 |
| 217 | Domestic industries | 9.3 | 9.9 | 63.2 | 9.3 | 0.8 | 1,729.3 |
| 218 | Financial | 1.6 | 0.1 | 32.1 | 62.7 | 27.2 | 502.5 |
| 219 | Nonfinancial | 7.6 | 9.8 | 31.1 | −53.3 | −26.4 | 1,226.8 |
| 220 | Rest of the world | 0.0 | 1.7 | 9.2 | 8.0 | 23.3 | 454.7 |
| 221 | Receipts from the rest of the world | 0.0 | 0.7 | −0.1 | −6.5 | 12.5 | 765.9 |
| 222 | Less: Payments to the rest of the world | 0.0 | −0.9 | −9.3 | −14.4 | −10.8 | 311.2 |
| 223 | Less: Taxes on corporate income | 0.0 | 1.0 | −1.3 | 3.5 | −10.0 | 275.6 |
| 224 | Equals: Profits after tax | 9.2 | 10.6 | 73.7 | 13.8 | 34.1 | 1,908.4 |
| 225 | Domestic industries | 9.3 | 8.9 | 64.5 | 5.9 | 10.8 | 1,453.7 |
| 226 | Rest of the world | 0.0 | 1.7 | 9.2 | 8.0 | 23.3 | 454.7 |
| 227 | Less: Net corporate dividend payments, National Income and Product Accounts | 0.0 | −6.3 | −51.7 | 25.6 | 28.8 | 1,394.9 |
| 228 | Domestic industries | 0.0 | 0.0 | −36.7 | 24.3 | 156.9 | 1,086.1 |
| 229 | Rest of the world | 0.0 | −6.3 | −15.0 | 1.3 | −128.1 | 308.7 |
| 230 | Equals: Undistributed corporate profits | 9.2 | 16.9 | 125.4 | −11.7 | 5.3 | 513.6 |
| 231 | Domestic industries | 9.3 | 8.9 | 101.2 | −18.4 | −146.1 | 367.6 |
| 232 | Rest of the world | 0.0 | 8.0 | 24.2 | 6.7 | 151.4 | 146.0 |
| Line | NIPA component and major source data incorporated1 | Revision in level | Level | ||||
|---|---|---|---|---|---|---|---|
| 2016 | 2017 | 2018 | 2019 | 2020 | 2020 | ||
| 233 | Net interest and miscellaneous payments
Revised corporate SOI for 2018; newly available corporate SOI for 2019; newly available sole proprietors and partnerships SOI for 2018. Updated extrapolation for 2019 based newly available SOI. |
−10.0 | −23.9 | −20.4 | −15.2 | −0.3 | 618.8 |
| 234 | Net interest | −9.8 | −23.6 | −19.8 | −15.3 | −1.4 | 600.0 |
| 235 | Domestic business | −8.2 | −23.2 | −21.1 | −7.2 | ... | 520.5 |
| 236 | Monetary interest paid
Newly available corporate SOI for 2019; revised corporate SOI for 2018; newly available sole proprietors and partnerships SOI for 2018. |
−14.4 | −27.9 | −38.2 | 4.0 | ... | 1,706.2 |
| 237 | Less: Monetary interest received
Newly available corporate SOI for 2019; revised corporate SOI for 2018; newly available sole proprietors and partnerships SOI for 2018. |
4.1 | 10.5 | −5.2 | 10.5 | ... | 2,101.2 |
| 238 | Imputed interest paid, depositor, insurance, and pension services | 1.1 | 8.8 | 14.3 | 12.9 | ... | 1,181.1 |
| 239 | Financial
Revised implicit and direct commisions received by regulated investment companies; newly available American Council for Life Insurers (ACLI) data on net investment income; revised imputed interest paid by State & Local pension plans for 2019. |
3.7 | 10.9 | 13.2 | 6.1 | ... | 1,171.2 |
| Of which: | |||||||
| 240 | Banks, credit agencies, and investment companies | 7.6 | 13.5 | 13.9 | 4.1 | ... | 351.3 |
| 241 | Nonfinancial | −2.6 | −2.1 | 1.1 | 6.8 | ... | 9.9 |
| 242 | Less: Imputed interest received, depositor, insurance, and pension services | −4.1 | −2.1 | 2.5 | 9.9 | ... | 410.3 |
| 243 | Imputed interest paid, borrower services | −1.2 | 0.5 | 5.5 | 9.4 | ... | −166.4 |
| 244 | Less: Imputed interest received, borrower services | −6.3 | −3.9 | 5.5 | 13.2 | ... | −311.1 |
| 245 | Owner-occupied housing | −1.6 | −1.2 | 0.8 | 2.8 | ... | 298.2 |
| 246 | Nonprofit institutions | 0.0 | 0.2 | 0.4 | 0.6 | ... | 5.8 |
| 247 | Rest of the world
Revised monetary and imputed payments and receipts from the ITAs for 1999–2020. |
−0.1 | 0.6 | 0.1 | −11.5 | −7.5 | −224.4 |
| 248 | Miscellaneous payments | −0.2 | −0.4 | −0.6 | 0.1 | 1.0 | 18.8 |
| 249 | Federal rents and royalties | 0.0 | 0.0 | 0.0 | −0.1 | −0.1 | 5.5 |
| 250 | State and local rents and royalties | −0.2 | −0.4 | −0.6 | 0.2 | 1.2 | 13.3 |
| 251 | Taxes on production and imports | −0.1 | 2.3 | 17.0 | 40.9 | 53.0 | 1,534.7 |
| 252 | Federal
Tax receipts data from Statistics of Income Division of the IRS for FY 2019; projections from Office of Tax Analysis; the FY 2022 federal budget. |
0.1 | 0.7 | 0.9 | 1.0 | 5.3 | 158.0 |
| 253 | State and local
FY 2017–FY 2019 Census Bureau Annual State Tax Collection Survey (STC) data, preliminary FY 2020 STC data. FY 2017–FY 2018 Census Bureau Local Government Finance Data, preliminary FY 2019 data. |
−0.2 | 1.7 | 16.1 | 39.9 | 47.7 | 1,376.6 |
| 254 | Less: Subsidies | 0.0 | 0.0 | 0.0 | −0.9 | 15.0 | 761.4 |
| 255 | Federal FY 2022 federal budget. |
0.0 | 0.0 | 0.0 | −0.9 | 15.0 | 760.8 |
| 256 | State and local | 0.0 | 0.0 | 0.0 | 0.0 | 0.0 | 0.6 |
| 257 | Business current transfer payments (net) | 2.3 | −1.6 | 1.5 | 4.3 | −6.0 | 158.6 |
| 258 | To persons (net)
Revised trade source data on insurance benefits for 2016–2020; revised IRS tabulations of corporate gifts for 2018 and new tabulations for 2019. |
0.1 | −0.1 | 2.8 | 8.8 | 12.7 | 59.9 |
| 259 | To government (net) | −0.2 | 0.0 | 2.8 | 6.7 | 7.6 | 97.8 |
| 260 | To the rest of the world (net)
Revised ITA data for 2013–2020. |
2.4 | −1.5 | −4.1 | −11.2 | −26.3 | 0.9 |
| 261 | Current surplus of government enterprises | −0.1 | −1.4 | −2.7 | −5.7 | 0.9 | −17.5 |
| 262 | Federal
Revised FY 2020 OMB Budget data for 2019 and 2020; new preliminary FY 2021 OMB Budget data for 2020. |
0.0 | 0.1 | 0.0 | −0.7 | −0.4 | −0.6 |
| 263 | State and local
Revised Census Bureau government finances FY 2017–FY 2018 tabulations for 2016–2018; new government finances FY 2019 tabulations for 2018 and 2019. |
−0.1 | −1.5 | −2.8 | −5.0 | 1.2 | −16.8 |
| Line | NIPA component and major source data incorporated1 | Revision in level | Level | ||||
|---|---|---|---|---|---|---|---|
| 2016 | 2017 | 2018 | 2019 | 2020 | 2020 | ||
| Addenda: | |||||||
| 264 | Gross national product | −50.1 | −61.1 | −75.2 | −63.9 | −24.5 | 21,116.1 |
| 265 | Gross saving | 23.2 | 40.4 | 98.6 | 167.7 | 190.2 | 4,002.9 |
| 266 | Personal income | −63.8 | −98.4 | −145.8 | −127.1 | −100.3 | 19,627.6 |
| 267 | Compensation of employees | 2.3 | 3.6 | 9.4 | 15.3 | 81.5 | 11,572.2 |
| 268 | Proprietors' income with IVA and CCAdj | −1.5 | −3.2 | −5.5 | −58.8 | −45.1 | 1,650.0 |
| 269 | Rental income of persons with CCAdj | −56.0 | −69.2 | −77.4 | −95.0 | −90.2 | 711.6 |
| 270 | Personal income receipts on assets | −9.1 | −30.6 | −78.4 | 0.1 | −0.7 | 2,912.1 |
| 271 | Personal interest income | −9.1 | −24.2 | −26.6 | −25.4 | −25.8 | 1,614.4 |
| 272 | Monetary interest received by persons | −14.5 | −35.8 | −38.9 | −32.4 | ... | 571.7 |
| 273 | Imputed interest received by persons, depositor, insurance, and pension services | 5.4 | 11.6 | 12.4 | 7.0 | ... | 1,041.6 |
| 274 | From banks, credit agencies, and investment companies | 9.1 | 14.0 | 13.4 | 5.5 | ... | 246.0 |
| 275 | From life insurance carriers | −0.9 | −1.0 | −1.7 | −3.1 | ... | 298.2 |
| 276 | From property and casualty insurance companies | 0.0 | 0.0 | 0.0 | −0.3 | ... | 10.7 |
| 277 | From employee pension plans | −2.7 | −1.5 | 0.7 | 4.8 | ... | 486.6 |
| 278 | Imputed interest received by nonprofit institutions | 0.0 | 0.0 | 0.0 | 0.0 | 0.0 | 1.1 |
| 279 | Personal dividend income | 0.0 | −6.3 | −51.8 | 25.5 | 25.2 | 1,297.8 |
| 280 | Personal current transfer receipts | 0.2 | 1.3 | 6.0 | 13.9 | −27.6 | 4,241.1 |
| 281 | Government social benefits to persons | 0.2 | 1.4 | 3.2 | 5.1 | −40.3 | 4,181.3 |
| 282 | Federal
Revised Centers for Medicare and Medicaid Services data on incurred Medicare benefits for 2016–2019; new data for 2020. New Department of Labor Employment and Training Administration data on UI benefits for 2020. Revised FY 2020 OMB Budget data for 2019 and 2020; new preliminary FY 2021 OMB Budget data for 2020. |
−0.3 | 0.0 | 0.7 | 0.9 | −39.7 | 3,373.0 |
| 283 | State and local | 0.5 | 1.4 | 2.5 | 4.2 | −0.6 | 808.3 |
| 284 | Other current transfer receipts, from business (net) | 0.1 | −0.1 | 2.8 | 8.8 | 12.7 | 59.9 |
| 285 | Less: Contributions for government social insurance, domestic | −0.3 | 0.4 | 0.0 | 2.6 | 18.3 | 1,459.5 |
| 286 | Federal
Social Security Administration data on wages and earnings (2016–2020); QCEW data (2020). |
−0.2 | 0.5 | 0.8 | 4.0 | 18.7 | 1,444.6 |
| 287 | State and local | −0.1 | −0.2 | −0.6 | −1.4 | −0.5 | 19.9 |
| 288 | Less: Personal current taxes | 0.3 | 2.3 | −9.0 | 2.2 | −7.1 | 2,195.6 |
| 289 | Federal
Treasury Department tax receipts and tax refunds data for 2020. |
0.0 | −1.1 | −1.0 | −4.4 | −17.2 | 1,679.6 |
| 290 | State and local
Revised Census Bureau government finances FY 2017–FY 2018 tabulations for 2016–2018; new FY 2019 tabulations for 2018 and 2019; revised FY 2017–FY 2019 Census Bureau state government tax collections tabulations for 2016 and 2019; new FY 2020 tabulations for 2019 and 2020; new Quarterly summary of tax revenue for 2020; revised for 2019. |
0.3 | 3.4 | −8.0 | 6.6 | 10.1 | 515.9 |
| 291 | Equals: Disposable personal income | −64.2 | −100.7 | −136.8 | −129.4 | −93.2 | 17,432.0 |
| 292 | Less: Personal outlays | −77.0 | −106.1 | −90.5 | −135.9 | −103.7 | 14,544.5 |
| 293 | Personal consumption expenditures | −76.7 | −101.2 | −79.8 | −115.9 | −97.8 | 14,047.6 |
| 294 | Personal interest payments | −0.2 | −5.7 | −11.9 | −22.0 | −13.7 | 285.4 |
| 295 | Monetary interest paid by persons
Revised Department of Education data on student loan balances for 2020. |
2.4 | −3.6 | −11.8 | −23.5 | −18.3 | 350.9 |
| 296 | Imputed interest paid by persons, borrower services | −2.7 | −2.2 | −0.1 | 1.5 | 4.5 | −65.4 |
| 297 | Personal current transfer payments | 0.0 | 0.9 | 1.2 | 2.0 | 7.8 | 211.5 |
| 298 | To government | 0.0 | 0.3 | 2.5 | 3.4 | 1.8 | 114.6 |
| 299 | To the rest of the world (net) | 0.0 | 0.5 | −1.3 | −1.4 | 6.0 | 96.9 |
| 300 | Equals: Personal saving | 12.8 | 5.4 | −46.4 | 6.6 | 10.5 | 2,887.5 |
- ACLI
- American Council for Life Insurers
- ARTS
- Annual retail trade survey
- ASM
- Annual survey of manufacturers
- BEA
- Bureau of Economic Analysis
- BLS
- Bureau of Labor Statistics
- CCAdj
- Capital consumption adjustment
- CPS/HVS
- Current population survey/housing vacancy survey
- DoL ETA
- Department of Labor, Employment and Training Administration
- FRB
- Federal Reserve Board
- FY
- Fiscal year
- IRS
- Internal Revenue Service
- ITAs
- International Transaction Accounts
- IVA
- Inventory valuation adjustment
- MEPS
- Medical Expenditure Panel Survey
- MRTS
- Monthly retail trade survey
- n.e.c.
- Not elsewhere classified
- NIPAs
- National income and product accounts
- NSF
- National Science Foundation
- OMB
- Office of Management and Budget
- QCEW
- Quarterly census of employment and wages
- SAS
- Service Annual Survey
- SOI
- Statistics of Income
- USDA
- U.S. Department of Agriculture
- In these descriptions, “new” indicates this is the first time that data from the specific source are being incorporated into the component estimate for the given year, and “revised” indicates that data from the specific source were incorporated previously and now revised data from that source are being incorporated.
- Revisions reflect the annual revision of BEA's international transactions accounts (ITAs). For more information, see Ami Adjoh-Baliki and Jason Sutterley, “Annual Update of the International Transactions Accounts” in the July 2021 Survey of Current Business.
- The statistical discrepancy is gross domestic product (GDP) less gross domestic income (GDI); it is also the difference between gross national product (GNP) and gross national income (GNI), which is GDI plus net income receipts from the rest of the world. The statistical discrepancy arises because the product-side measures of GDP and GNP are estimated independently from the income-side measures of GDI and GNI.
Annual NIPA estimates for 1929 forward and quarterly estimates for 1947 forward are available on BEA's website in more than 350 interactive tables that are arranged in roughly the same order as the 7 summary accounts.8 The tables can be downloaded in a variety of formats, customized by date and by frequency, and displayed in charts.9
The following selected revised NIPA tables will be released later this fall:
- Table 2.9 (personal income by households and by nonprofit institutions serving households (NPISH))
- Tables 3.15–3.17 (government spending by function)
- Tables 3.18 and 3.19 (reconciliation of federal government and of state and local government spending estimates with related source data)
- Tables 3.20 and 3.21 (state government and local government current receipts and expenditures)
- Table 5.10 (changes in net stocks of fixed assets and inventories)
- Table 7.19 (reconciliation of NIPA income and outlays of NPISH with IRS revenue and expenses)
In addition, several other BEA estimates will be updated later this year to reflect the results of this year's NIPA update. They are as follows:
- The IEAs, which provide a detailed view of the interrelationships between U.S. producers and users and the contribution to production across industries, will be released on September 30, 2021. The NIPAs and the IEAs have been conceptually integrated, and their estimates have been consistent since 2013.
- The GDP by state estimates, which provide comprehensive measures of the economies of each state and the District of Columbia, will be released on October 1, 2021. As with the IEAs, the by-state measures of GDP are consistent with the national and industry measures of GDP.
- The integrated macroeconomic accounts published jointly by BEA and the FRB, which relate production, income and spending, capital formation, financial transactions, and asset revaluations to changes in net worth for the major sectors of the U.S. economy, will be released later this year.
| Account 1. Domestic Income and Product Account | |||||
|---|---|---|---|---|---|
| Line | Series | 2020 | Line | Series | 2020 |
| 1 | Compensation of employees, paid | 11,580.1 | 15 | Personal consumption expenditures (3-3) | 14,047.6 |
| 2 | Wages and salaries | 9,452.0 | 16 | Goods | 4,653.8 |
| 3 | Domestic (3-12) | 9,437.6 | 17 | Durable goods | 1,616.4 |
| 4 | Rest of the world (5-15) | 14.4 | 18 | Nondurable goods | 3,037.4 |
| 5 | Supplements to wages and salaries (3-14) | 2,128.0 | 19 | Services | 9,393.7 |
| 6 | Taxes on production and imports (4-15) | 1,534.7 | 20 | Gross private domestic investment | 3,637.8 |
| 7 | Less: Subsidies (4-8) | 761.4 | 21 | Fixed investment (6-2) | 3,697.4 |
| 8 | Net operating surplus | 5,135.0 | 22 | Nonresidential | 2,799.6 |
| 9 | Private enterprises (2-19) | 5,152.5 | 23 | Structures | 597.2 |
| 10 | Current surplus of government enterprises (4-28) | −17.5 | 24 | Equipment | 1,123.9 |
| 11 | Consumption of fixed capital (6-14) | 3,575.9 | 25 | Intellectual property products | 1,078.5 |
| 26 | Residential | 897.8 | |||
| 12 | Gross domestic income | 21,064.3 | 27 | Change in private inventories (6-4) | −59.6 |
| 28 | Net exports of goods and services | −651.2 | |||
| 13 | Less: Statistical discrepancy (6-20) | −170.6 | 29 | Exports (5-1) | 2,123.4 |
| 30 | Imports (5-13) | 2,774.6 | |||
| 31 | Government consumption expenditures and gross investment (4-1 plus 6-3) | 3,859.5 | |||
| 32 | Federal | 1,501.8 | |||
| 33 | National defense | 881.3 | |||
| 34 | Nondefense | 620.5 | |||
| 35 | State and local | 2,357.8 | |||
| 14 | Gross domestic product | 20,893.7 | 36 | Gross domestic product | 20,893.7 |
| Account 2. Private Enterprise Income Account | |||||
|---|---|---|---|---|---|
| Line | Series | 2020 | Line | Series | 2020 |
| 1 | Income payments on assets | 3,356.4 | 19 | Net operating surplus, private enterprises (1-9) | 5,152.5 |
| 2 | Interest and miscellaneous payments (2-21 and 3-20 and 4-22 and 5-17) | 3,045.2 | 20 | Income receipts on assets | 2,967.9 |
| 3 | Dividend payments to the rest of the world (5-18) | 228.5 | 21 | Interest (2-2 and 3-4 and 4-7 and 5-5) | 2,202.0 |
| 4 | Reinvested earnings on foreign direct investment in the United States (5-19) | 82.7 | 22 | Dividend receipts from the rest of the world (5-6) | 537.2 |
| 5 | Business current transfer payments (net) | 158.6 | 23 | Reinvested earnings on U.S. direct investment abroad (5-7) | 228.7 |
| 6 | To persons (net) (3-24) | 59.9 | |||
| 7 | To government (net) (4-25) | 97.8 | |||
| 8 | To the rest of the world (net) (5-23 less 5-11 less 2-14) | 0.9 | |||
| 9 | Proprietors' income with IVA and CCAdj (3-17) | 1,650.0 | |||
| 10 | Rental income of persons with IVA and CCAdj (3-18) | 711.6 | |||
| 11 | Corporate profits with IVA and CCAdj | 2,243.8 | |||
| 12 | Taxes on corporate income | 275.6 | |||
| 13 | To government (4-16) | 263.8 | |||
| 14 | To the rest of the world (5-23) | 11.9 | |||
| 15 | Profits after tax with IVA and CCAdj | 1,968.1 | |||
| 16 | Net dividends (3-21 plus 4-23) | 1,394.9 | |||
| 17 | Undistributed corporate profits with IVA and CCAdj (6-12) | 573.3 | |||
| 18 | Uses of private enterprise income | 8,120.4 | 24 | Sources of private enterprise income | 8,120.4 |
| Account 3. Personal Income and Outlay Account | |||||
|---|---|---|---|---|---|
| Line | Series | 2020 | Line | Series | 2020 |
| 1 | Personal current taxes (4-14) | 2,195.6 | 10 | Compensation of employees | 11,572.2 |
| 2 | Personal outlays | 14,544.5 | 11 | Wages and salaries | 9,444.1 |
| 3 | Personal consumption expenditures (1-15) | 14,047.6 | 12 | Domestic (1-3) | 9,437.6 |
| 4 | Personal interest payments (2-21 and 3-20 and 4-22 and 5-17) | 285.4 | 13 | Rest of the world (5-3) | 6.5 |
| 5 | Personal current transfer payments | 211.5 | 14 | Supplements to wages and salaries (1-5) | 2,128.0 |
| 6 | To government (4-26) | 114.6 | 15 | Employer contributions for employee pension and insurance funds | 1,464.4 |
| 7 | To the rest of the world (net) (5-21 less 5-9) | 96.9 | 16 | Employer contributions for government social insurance | 663.7 |
| 8 | Personal saving (6-11) | 2,887.5 | 17 | Proprietors' income with IVA and CCAdj (2-9) | 1,650.0 |
| 18 | Rental income of persons with CCAdj (2-10) | 711.6 | |||
| 19 | Personal income receipts on assets | 2,912.1 | |||
| 20 | Personal interest income (2-2 plus 3-4 plus 4-7 plus 5-5 less 2-21 less 4-22 less 5-17) | 1,614.4 | |||
| 21 | Personal dividend income (2-16 less 4-23) | 1,297.8 | |||
| 22 | Personal current transfer receipts | 4,241.1 | |||
| 23 | Government social benefits (4-4) | 4,181.3 | |||
| 24 | From business (net) (2-6) | 59.9 | |||
| 25 | Less: Contributions for government social insurance, domestic (4-19) | 1,459.5 | |||
| 9 | Personal taxes, outlays, and saving | 19,627.6 | 26 | Personal income | 19,627.6 |
| Account 4. Government Receipts and Expenditures Account | |||||
|---|---|---|---|---|---|
| Line | Series | 2020 | Line | Series | 2020 |
| 1 | Consumption expenditures (1-31) | 3,078.0 | 13 | Current tax receipts | 4,021.4 |
| 2 | Current transfer payments | 4,265.8 | 14 | Personal current taxes (3-1) | 2,195.6 |
| 3 | Government social benefits | 4,214.4 | 15 | Taxes on production and imports (1-6) | 1,534.7 |
| 4 | To persons (3-23) | 4,181.3 | 16 | Taxes on corporate income (2-13) | 263.8 |
| 5 | To the rest of the world (5-22) | 33.1 | 17 | Taxes from the rest of the world (5-10) | 27.4 |
| 6 | Other current transfer payments to the rest of the world (5-22) | 51.4 | 18 | Contributions for government social insurance | 1,464.5 |
| 7 | Interest payments (2-21 and 3-20 and 4-22 and 5-17) | 829.2 | 19 | From persons (3-25) | 1,459.5 |
| 8 | Subsidies (1-7) | 761.4 | 20 | From the rest of the world (5-10) | 5.1 |
| 9 | Net government saving (6-13) | −3,033.9 | 21 | Income receipts on assets | 216.2 |
| 10 | Federal | −3,110.0 | 22 | Interest and miscellaneous receipts (2-2 and 3-4 and 4-7 and 5-5) | 119.1 |
| 11 | State and local | 76.1 | 23 | Dividends (2-16 less 3-21) | 97.1 |
| 24 | Current transfer receipts | 215.9 | |||
| 25 | From business (net) (2-7) | 97.8 | |||
| 26 | From persons (3-6) | 114.6 | |||
| 27 | From the rest of the world (5-10) | 3.5 | |||
| 28 | Current surplus of government enterprises (1-10) | −17.5 | |||
| 12 | Government current expenditures and net saving | 5,900.6 | 29 | Government current receipts | 5,900.6 |
| Account 5. Foreign Transactions Current Account | |||||
|---|---|---|---|---|---|
| Line | Series | 2020 | Line | Series | 2020 |
| 1 | Exports of goods and services (1-29) | 2,123.4 | 13 | Imports of goods and services (1-30) | 2,774.6 |
| 2 | Income receipts from the rest of the world | 992.9 | 14 | Income payments to the rest of the world | 770.6 |
| 3 | Wage and salary receipts (3-13) | 6.5 | 15 | Wage and salary payments (1-4) | 14.4 |
| 4 | Income receipts on assets | 986.4 | 16 | Income payments on assets | 756.1 |
| 5 | Interest (2-21 and 3-20 and 4-22) | 220.5 | 17 | Interest (2-2 and 3-4 and 4-7) | 445.0 |
| 6 | Dividends (2-22) | 537.2 | 18 | Dividends (2-3) | 228.5 |
| 7 | Reinvested earnings on U.S. direct investment abroad (2-23) | 228.7 | 19 | Reinvested earnings on foreign direct investment in the United States (2-4) | 82.7 |
| 8 | Current taxes, contributions for government social insurance, and transfer receipts from the rest of the world | 171.4 | 20 | Current taxes and transfer payments to the rest of the world | 329.6 |
| 9 | To persons (3-7) | 8.9 | 21 | From persons (3-7) | 105.8 |
| 10 | To government (4-17 plus 4-20 plus 4-27) | 36.0 | 22 | From government (4-5 plus 4-6) | 84.5 |
| 11 | To business (2-8) | 126.5 | 23 | From business (2-8 and 2-14) | 139.3 |
| 24 | Balance on current account, national income and product accounts (7-1) | −587.1 | |||
| 12 | Current receipts from the rest of the world | 3,287.7 | 25 | Current payments to the rest of the world and balance on current account, NIPAs | 3,287.7 |
| Account 6. Domestic Capital Account | |||||
|---|---|---|---|---|---|
| Line | Series | 2020 | Line | Series | 2020 |
| 1 | Gross domestic investment | 4,419.4 | 10 | Net saving | 426.9 |
| 2 | Private fixed investment (1-21) | 3,697.4 | 11 | Personal saving (3-8) | 2,887.5 |
| 3 | Government fixed investment (1-31) | 781.5 | 12 | Undistributed corporate profits with IVA and CCAdj (2-17) | 573.3 |
| 4 | Change in private inventories (1-27) | −59.6 | 13 | Net government saving (4-9) | −3,033.9 |
| 5 | Capital account transactions (net) | 5.9 | 14 | Plus: Consumption of fixed capital (1-11) | 3,575.9 |
| 6 | Transfer payments for catastrophic losses (net) (7-3) | 6.1 | 15 | Private | 2,969.6 |
| 7 | Other capital account transactions (7-4) | −0.2 | 16 | Government | 606.4 |
| 8 | Net lending or net borrowing (−), national income and product accounts (7-5) | −593.0 | 17 | General government | 523.5 |
| 18 | Government enterprises | 82.8 | |||
| 19 | Equals: Gross saving | 4,002.9 | |||
| 20 | Statistical discrepancy (1-13) | −170.6 | |||
| 9 | Gross domestic investment, capital account transactions (net), and net lending, NIPAs | 3,832.3 | 21 | Gross saving and statistical discrepancy | 3,832.3 |
| Account 7. Foreign Transactions Capital Account | |||||
|---|---|---|---|---|---|
| Line | Series | 2020 | Line | Series | 2020 |
| 2 | Capital account transactions (net) (6-5) | 5.9 | |||
| 3 | Transfer payments for catastrophic losses (net) (6-6) | 6.1 | |||
| 4 | Other capital account transactions (6-7) | −0.2 | |||
| 5 | Net lending or net borrowing (−), national income and product accounts (6-8) | −593.0 | |||
| 1 | Balance on current account, NIPAs (5-24) | −587.1 | 6 | Capital account transactions (net) and net lending, NIPAs (6-5) | −587.1 |
- CCAdj
- Capital consumption adjustment
- IVA
- Inventory valuation adjustment
- NIPAs
- National Income and Product Accounts
Note. The seven summary accounts constitute a double-entry accounting system in which each of the entries in a summary account appears again in that account or in one of the other summary accounts. The numbers in parentheses indicate these “counterentries.” In some cases, an entry may be equal to another entry in the summary accounts. For example, supplements to wages and salaries appears in account 1, line 5 and in account 3, line 14. In other cases, an entry may be equal to a combination of other entries (or of parts of other entries). For example, for private enterprise interest payments (account 2, line 2), the counterentry includes parts of private enterprise interest receipts (account 2, line 21), of personal interest income (account 3, line 20), of government interest receipts (account 4, line 22), and of interest payments to the rest of the world (account 5, line 17).
| Line | Series | 2016 | 2017 | 2018 | 2019 | 2020 | Seasonally adjusted at annual rates | ||||
|---|---|---|---|---|---|---|---|---|---|---|---|
| 2020 | 2021 | ||||||||||
| Q1 | Q2 | Q3 | Q4 | Q1 | |||||||
| Production in the United States: | |||||||||||
| 1 | Gross domestic product (GDP) | 1.7 | 2.3 | 2.9 | 2.3 | −3.4 | −5.1 | −31.2 | 33.8 | 4.5 | 6.3 |
| 2 | Gross domestic income (GDI) | 0.9 | 2.4 | 2.9 | 2.0 | −2.9 | −0.8 | −32.7 | 24.4 | 19.6 | 6.3 |
| 3 | Average of GDP and GDI1 | 1.3 | 2.3 | 2.9 | 2.1 | −3.2 | −3.0 | −32.0 | 29.0 | 11.9 | 6.3 |
| 4 | Net domestic product2 | 1.5 | 2.2 | 2.9 | 2.1 | −4.6 | −6.6 | −36.7 | 41.7 | 4.9 | 6.9 |
| 5 | Net domestic income2 | 0.5 | 2.3 | 2.9 | 1.8 | −4.0 | −1.5 | −38.3 | 29.7 | 23.3 | 6.9 |
| Production by labor and capital supplied by U.S. residents: | |||||||||||
| 6 | Gross national product | 1.7 | 2.5 | 2.8 | 2.1 | −3.6 | −5.4 | −31.9 | 34.8 | 4.9 | 5.9 |
| 7 | Gross national income | 0.9 | 2.6 | 2.8 | 1.8 | −3.1 | −1.2 | −33.3 | 25.4 | 19.9 | 5.9 |
| 8 | Net national product2 | 1.5 | 2.5 | 2.8 | 1.9 | −4.8 | −7.0 | −37.3 | 42.9 | 5.3 | 6.4 |
| Final expenditures by U.S. residents: | |||||||||||
| 9 | Gross domestic purchases | 1.8 | 2.4 | 3.1 | 2.4 | −3.0 | −4.9 | −30.8 | 37.8 | 6.1 | 7.7 |
| 10 | Final sales to domestic purchasers3 | 2.3 | 2.4 | 3.0 | 2.4 | −2.5 | −4.4 | −27.3 | 29.9 | 5.0 | 10.4 |
| 11 | Final sales to private domestic purchasers4 | 2.4 | 2.8 | 3.3 | 2.4 | −3.6 | −6.0 | −32.8 | 38.4 | 6.2 | 11.8 |
| Purchasing power of income:5 | |||||||||||
| 12 | Command-basis gross domestic product | 2.0 | 2.3 | 3.0 | 2.5 | −3.4 | −5.4 | −31.6 | 34.3 | 4.7 | 6.7 |
| 13 | Command-basis net domestic product2 | 1.8 | 2.2 | 3.0 | 2.4 | −4.6 | −7.0 | −37.1 | 42.4 | 5.0 | 7.4 |
| 14 | Command-basis gross national product | 2.0 | 2.5 | 2.9 | 2.3 | −3.6 | −5.7 | −32.3 | 35.3 | 5.0 | 6.2 |
| 15 | Command-basis net national product2 | 1.9 | 2.5 | 2.9 | 2.2 | −4.8 | −7.3 | −37.8 | 43.6 | 5.5 | 6.8 |
| After-tax income received by the personal sector: | |||||||||||
| 16 | Disposable personal income | 1.8 | 2.8 | 3.4 | 2.3 | 6.2 | 3.1 | 48.5 | −16.6 | −8.3 | 57.6 |
- The arithmetic average of gross domestic product and of gross domestic income, deflated by the implicit price deflator for GDP.
- In this table, the net measures are the corresponding gross measures excluding the depreciation of fixed assets as measured by the consumption of fixed capital.
- Gross domestic purchases excluding change in private inventories.
- Final sales to domestic purchasers less government consumption expenditures and gross investment.
- The command-basis estimates (lines 12–15) measure the purchasing power of the income generated by the sale of goods and services produced; they reflect gains or losses in real income resulting from changes in the terms of trade for exports and imports. For more detail on the command-basis measures, see NIPA tables 1.8.3 and 1.8.6.
| Line | Series | 2016 | 2017 | 2018 | 2019 | 2020 | Seasonally adjusted at annual rates | ||||
|---|---|---|---|---|---|---|---|---|---|---|---|
| 2020 | 2021 | ||||||||||
| Q1 | Q2 | Q3 | Q4 | Q1 | |||||||
| Production in the United States: | |||||||||||
| 1 | Gross domestic product (GDP) | 17,680.3 | 18,079.1 | 18,606.8 | 19,032.7 | 18,384.7 | 18,952.0 | 17,258.2 | 18,560.8 | 18,767.8 | 19,055.7 |
| 2 | Gross domestic income (GDI) | 17,768.6 | 18,189.4 | 18,720.5 | 19,094.7 | 18,534.8 | 19,194.2 | 17,384.7 | 18,358.8 | 19,200.3 | 19,496.4 |
| 3 | Average of GDP and GDI1 | 17,724.5 | 18,134.3 | 18,663.6 | 19,063.7 | 18,459.7 | 19,073.1 | 17,321.5 | 18,459.8 | 18,984.0 | 19,276.0 |
| 4 | Net domestic product2 | 14,806.4 | 15,127.5 | 15,567.2 | 15,896.9 | 15,168.1 | 15,758.4 | 14,056.6 | 15,337.3 | 15,520.3 | 15,780.6 |
| 5 | Net domestic income2 | 14,894.5 | 15,237.4 | 15,680.4 | 15,958.6 | 15,317.5 | 15,999.2 | 14,182.6 | 15,136.2 | 15,951.0 | 16,219.1 |
| Production by labor and capital supplied by U.S. residents: | |||||||||||
| 6 | Gross national product | 17,901.9 | 18,354.6 | 18,874.6 | 19,271.9 | 18,582.3 | 19,166.1 | 17,412.7 | 18,762.5 | 18,987.9 | 19,262.1 |
| 7 | Gross national income | 17,990.3 | 18,464.9 | 18,988.3 | 19,334.0 | 18,732.4 | 19,408.3 | 17,539.2 | 18,560.5 | 19,420.5 | 19,702.9 |
| 8 | Net national product2 | 15,028.0 | 15,402.8 | 15,834.9 | 16,136.2 | 15,365.9 | 15,972.6 | 14,211.3 | 15,539.1 | 15,740.5 | 15,987.2 |
| Final expenditures by U.S. residents: | |||||||||||
| 9 | Gross domestic purchases | 18,423.5 | 18,857.5 | 19,443.0 | 19,910.1 | 19,306.6 | 19,787.6 | 18,046.1 | 19,551.0 | 19,841.7 | 20,211.1 |
| 10 | Final sales to domestic purchasers3 | 18,374.6 | 18,809.7 | 19,365.4 | 19,822.0 | 19,319.8 | 19,777.4 | 18,264.4 | 19,498.9 | 19,738.3 | 20,233.6 |
| 11 | Final sales to private domestic purchasers4 | 15,228.6 | 15,647.9 | 16,161.0 | 16,547.3 | 15,959.0 | 16,433.7 | 14,879.0 | 16,139.0 | 16,384.1 | 16,846.3 |
| Purchasing power of income:5 | |||||||||||
| 12 | Command-basis gross domestic product | 17,943.8 | 18,349.8 | 18,893.3 | 19,372.3 | 18,708.3 | 19,292.4 | 17,543.5 | 18,886.6 | 19,102.4 | 19,413.0 |
| 13 | Command-basis net domestic product2 | 15,069.7 | 15,397.9 | 15,853.8 | 16,235.8 | 15,486.9 | 16,096.8 | 14,333.2 | 15,658.6 | 15,850.5 | 16,134.2 |
| 14 | Command-basis gross national product | 18,166.5 | 18,627.2 | 19,164.0 | 19,613.7 | 18,907.3 | 19,507.9 | 17,698.4 | 19,089.2 | 19,325.3 | 19,619.8 |
| 15 | Command-basis net national product2 | 15,292.2 | 15,675.1 | 16,124.1 | 16,476.9 | 15,685.7 | 16,311.8 | 14,488.0 | 15,861.0 | 16,073.2 | 16,340.7 |
| After-tax income received by the personal sector: | |||||||||||
| 16 | Disposable personal income | 13,575.5 | 13,956.6 | 14,429.4 | 14,755.2 | 15,672.8 | 14,962.7 | 16,516.9 | 15,782.4 | 15,443.0 | 17,304.3 |
- The arithmetic average of gross domestic product and of gross domestic income, deflated by the implicit price deflator for GDP.
- In this table, the net measures are the corresponding gross measures excluding the depreciation of fixed assets as measured by the consumption of fixed capital.
- Gross domestic purchases excluding change in private inventories.
- Final sales to domestic purchasers less government consumption expenditures and gross investment.
- The command-basis estimates (lines 12–15) measure the purchasing power of the income generated by the sale of goods and services produced; they reflect gains or losses in real income resulting from changes in the terms of trade for exports and imports. For more detail on the command-basis measures, see NIPA tables 1.8.3 and 1.8.6.
| Line | Series | 2016 | 2017 | 2018 | 2019 | 2020 | Seasonally adjusted at annual rates | ||||
|---|---|---|---|---|---|---|---|---|---|---|---|
| 2020 | 2021 | ||||||||||
| Q1 | Q2 | Q3 | Q4 | Q1 | |||||||
| Production in the United States: | |||||||||||
| 1 | Gross domestic product (GDP) | 18,695.1 | 19,479.6 | 20,527.2 | 21,372.6 | 20,893.7 | 21,481.4 | 19,477.4 | 21,138.6 | 21,477.6 | 22,038.2 |
| 2 | Gross domestic income (GDI) | 18,788.5 | 19,598.5 | 20,652.6 | 21,442.2 | 21,064.3 | 21,755.9 | 19,620.2 | 20,908.5 | 21,972.6 | 22,547.9 |
| 3 | Average of GDP and GDI1 | 18,741.8 | 19,539.1 | 20,589.9 | 21,407.4 | 20,979.0 | 21,618.6 | 19,548.8 | 21,023.6 | 21,725.1 | 22,293.1 |
| 4 | Net domestic product2 | 15,708.0 | 16,361.5 | 17,253.7 | 17,937.0 | 17,317.8 | 17,959.0 | 15,926.6 | 17,547.5 | 17,838.2 | 18,342.3 |
| 5 | Net domestic income2 | 15,801.5 | 16,480.4 | 17,379.2 | 18,006.6 | 17,488.4 | 18,233.5 | 16,069.3 | 17,317.5 | 18,333.2 | 18,851.9 |
| Production by labor and capital supplied by U.S. residents: | |||||||||||
| 6 | Gross national product | 18,927.1 | 19,774.2 | 20,821.3 | 21,639.0 | 21,116.1 | 21,721.3 | 19,649.4 | 21,365.4 | 21,728.2 | 22,273.1 |
| 7 | Gross national income | 19,020.5 | 19,893.1 | 20,946.8 | 21,708.7 | 21,286.6 | 21,995.8 | 19,792.2 | 21,135.4 | 22,223.2 | 22,782.7 |
| 8 | Net national product2 | 15,940.0 | 16,656.0 | 17,547.9 | 18,203.4 | 17,540.2 | 18,198.9 | 16,098.6 | 17,774.4 | 18,088.8 | 18,577.1 |
| 9 | National income3 | 16,033.4 | 16,774.9 | 17,673.3 | 18,273.1 | 17,710.7 | 18,473.4 | 16,241.3 | 17,544.3 | 18,583.8 | 19,086.8 |
| Final expenditures by U.S. residents: | |||||||||||
| 10 | Gross domestic purchases | 19,201.4 | 20,019.6 | 21,123.3 | 21,968.8 | 21,544.9 | 22,023.1 | 20,016.3 | 21,864.3 | 22,276.0 | 22,910.8 |
| 11 | Final sales to domestic purchasers4 | 19,165.1 | 19,990.1 | 21,064.6 | 21,895.2 | 21,604.5 | 22,043.7 | 20,306.3 | 21,849.3 | 22,218.8 | 23,005.0 |
| 12 | Final sales to private domestic purchasers5 | 15,862.0 | 16,591.0 | 17,492.6 | 18,181.3 | 17,745.0 | 18,212.0 | 16,446.7 | 17,987.6 | 18,333.5 | 19,027.7 |
| After-tax income received by the personal sector: | |||||||||||
| 13 | Disposable personal income | 14,138.7 | 14,801.2 | 15,629.7 | 16,219.3 | 17,432.0 | 16,600.6 | 18,249.6 | 17,595.7 | 17,282.2 | 19,548.6 |
- The arithmetic average of gross domestic product and of gross domestic income.
- In this table, net measures are the corresponding gross measures excluding the depreciation of fixed assets as measured by the consumption of fixed capital.
- Equals gross national income less the depreciation of fixed assets as measured by the consumption of fixed capital.
- Equals gross domestic purchases less change in private inventories.
- Final sales to domestic purchasers less government consumption expenditures and gross investment.
- See “The 2020 Annual Update of the National Income and Product Accounts,” Survey of Current Business 100 (August 2020).
- The ACS is an annual survey that replaces the discontinued “long form” of the Census Bureau's Decennial Census of Population and Housing. For more information about the ACS, see the Census Bureau's website at census.gov.
- For more information on the new source data and estimating method underlying measures of housing services, see Dylan G. Rassier, Bettina H. Aten, Eric B. Figueroa, Solomon Kublashvili, Brian J. Smith, and Jack York, “Improved Measures of Housing Services for the U.S. Accounts,” Survey 101 (May 2021).
- For more information on last year's annual update of the NIPAs, see note 1 above.
- For more information on these improvements, see Rudy Telles Jr., Nick Martinez, and Ted Peck, “Annual Update of the U.S. International Transactions Accounts,” Survey 100 (July 2020).
- See note 3 above.
- For more information on the 2021 annual update of the ITAs, see Ami Adjoh-Baliki and Jason Sutterley, “Annual Update of the U.S. International Transactions Accounts,” Survey 101 (July 2021).
- The fixed assets accounts, which present estimates of capital investment by legal form and by type, will be updated for 2016–2020 to reflect the results of the annual update of the NIPAs; the tables will be released in the coming weeks.
- For a detailed description of the NIPA table numbering system, see the FAQ “How are the NIPA tables organized?” on BEA's website.