
![]()
Commemorative Poster Source Information
References for the centennial posters are categorized by decade and section. Each reference includes the Survey of Current Business issue and page number and the article, box, chart, or table title and a link to view it. References to photographs include links to archival or stock image websites.
The 1920s
Business Conditions After the Great War
Consumables
Oleomargarine, coffee, cigars, leather shoes, rubber tires, and automobile sales accelerate. Ten-cent store F.W. Woolworth Co. reports monthly sales of $11.6 million in August 1921.
- Oleomargarine
August 1924 p. 6, Production of Specified Commodities in the First Half of 1924; July 1928 p. 39, Trend of Business Movements - Coffee
May 1926 p. 18, Sugar, Coffee, and Tea; p. 44, Trend of Business Movements - Cigars
October 1921 p. 59, Tobacco Table 46 (A) Index Numbers and (B) Numerical Data; May 1926 p. 44, Trend of Business Movements - Leather shoes
July 1926 p. 21, Indexes of Business; p. 10, Summary of Indexes of Business; p. 14, Summary of Indexes of Business - Rubber tires
July 1921 p. 51, Table 27b Numerical Data; May 1922 p. 13, Rubber - Automobiles
May 1922 p. 7, Comparison of Present Production With Pre-War; p. 13, Automobiles; p. 65, Automobiles and Rubber - Ten-cent store F.W. Woolworth Co. reports monthly sales of $11.6 million in August 1921 September 1921 p. 77, Retail Movement
![]()
Survey clippings
- December 1921 p. 10, Summary of the Month's Developments
- November 1922 p.7, Business Conditions in September
Photograph
Library of Congress photo
Control Number: 2001706332
Factory Wages
Pittsburgh steelworkers earn 36 cents an hour in September 1922. Such factory employment data are collected from 1,428 firms in 1923 then consolidated into 50 manufacturing industries in 1929.
- Pittsburgh steelworkers earn 36 cents an hour in September 1922
September 1922 p. 49, Wages, Common Labor - Factory employment data from 1,428 firms in 1923
December 1923 p. 19, Labor - Factory employment consolidated into 50 manufacturing industries in 1929
December 1929 p. 19, Factory Employment: Indexes by Groups
Survey clippings
- September 1922 p. 49, Wages, Common Labor table
- October 1928 p. 8, Factory Employment, Manufacturing, and Electric Power Production table
Photograph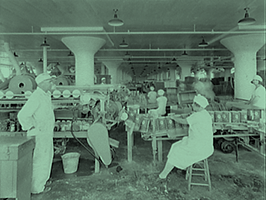
Library of Congress photo
Control Number: 2019671257
Stock Market
New York Stock Exchange monthly reports range from an “abundance of money to be had at comparatively low rates” in 1922 to “a substantial decline” in brokers' loans in 1929.
- Abundance of money to be had at comparatively low rates
September 1922 p. 1, Summary for July - A substantial decline in brokers' loans in 1929
December 1929 p. 1, Preliminary Summary for November
Survey clippings
- September 1922 p. 1, Summary for July
- November 1929 p. 1, Preliminary Summary for October
Photograph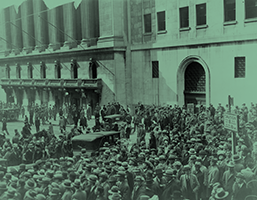
Library of Congress photo
Control Number: 99471695
Farm Prices
Twelve crops are featured in 1921. Crops are reorganized into categories as the list expands. In 1929, farmers earn $31.03 per ton of cottonseed and $1.35 per bushel of potatoes.
- Twelve crops are featured in 1921
July 1921 p. 4, Contents - Crops are reorganized into categories as the list expands
December 1929 p. 15, Indexes of Business - In 1929, farmers earn $31.03 per ton of cottonseed and $1.35 per bushes of potatoes
December 1929 p. 7, table Wholesale Prices for Specified Commodities
Survey clippings
- December 1921 p. 9, Wholesale Price Comparisons table
- July 1926 p. 6, Wholesale Prices in May
Photograph
Library of Congress photo
Control Number: 2012646389
The 1930s
The Depression and Recovery Efforts
Dust Bowl
Farm real estate value declines 31.4 percent between 1930 and 1935. In 1931, farm products drop below 1913 levels. The drought is “the worst in our history” and by 1936 becomes “more widespread and severe.”
- Farm real estate value declines 31.4 percent between 1930 and 1935
November 1937 pp. 13–14, Farm Mortgage Credit 1930–37 - In 1931, farm products drop below 1913 levels
August 1931 p. 7, Commodity Prices - Drought is the worst in our history
August 1936 p. 3, Business Situation Summarized - 1936 becomes more widespread and severe
August 1936 p. 5, Commodity Prices
![]()
Survey clippings
- August 1936 p. 3, Business Situation Summarized; p. 5, Commodity Prices
- November 1937 p. 12, Farm Mortgage Credit 1930–37
- November 1937 p. 14, Farm Mortgage Debt and Land Values, by States
Photograph
Library of Congress photo
Control Number: 2017730132
Prohibition Ends
Vinous liquors' product value increases 2,437.8 percent from 1931 to 1933. Whisky distilled in 1936 reaches an unprecedented 245.5 million total tax gallons. Five percent of retail-trade employment is at liquor establishments.
- Vinous liquors' product value increases 2,437.8 percent from 1931 to 1933
March 1935 p. 17, Industries Showing an Increase in Value of Products, 1933 over 1931 - Whisky distilled in 1936 reaches an unprecedented 245.5 million total tax gallons
July 1939 p. 13, Alcoholic Beverage Industry Reestablished - Five percent of retail-trade employment is at liquor establishments
July 1939 p. 12, Alcoholic Beverage Industry Reestablished
Survey clippings
- July 1939 p. 10, Alcoholic Beverage Industry Reestablished
- July 1939 p. 13, Whisky Imports From the United Kingdom and Canada, Fiscal Year 1913 and Calendar Years 1934–38
Photograph
Library of Congress photo
Control Number: 2017783279
New Deal
The Federal government's Public Works Administration finances work-relief construction projects like highways, sewer systems, electrical grids, and dams. Federal construction is valued at $2.43 billion in 1938, compared to $503 million in 1932.
- The Federal government's Public Works Administration finances work-relief construction projects like highways, sewer systems, electrical grids, and dams
April 1937 pp. 16–17, The Position of the Construction Industry - Federal construction is valued at $2.43 billion in 1938, compared to $503 million in 1932
December 1938 p. 11, Estimated Value of Private and Public Construction, Including New Construction, Maintenance, and Work-Relief Construction
Survey clippings
- April 1937 p. 15, The Position of the Construction Industry
- December 1938 p. 11, Construction Trends in the United States 1937 and 1938
Photograph
Library of Congress photo
Control Number: 2008676666
Great Depression
Brokers' loans decline as liquidations continue in 1931. Dollar sales volume for chain stores and mail-order houses reach a new low in 1932. A year later, national income is still dropping.
- Brokers' loans decline as liquidations continue in 1931
August 1931 p. 5, Finance—Security and Money Markets - Dollar sales volume for chain stores and mail-order houses reach a new low in 1932
June 1932 p. 6, Domestic Trade - 1933 national income is still dropping
January 1935 p. 16, The National Income, 1933
Survey clippings
- August 1931 p. 3, Business Situation Summarized
- August 1932 p. 6, Domestic Trade
- January 1935 p. 16, The National Income, 1933
Photograph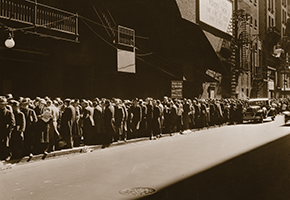
Library of Congress photo
Control Number: 2017696878
The 1940s
The War Economy
Civilian Labor
Women are needed to provide the bulk of additions to the U.S. labor force. In 1943, women hold 32 percent of civilian jobs, including 14.1 million in nonagricultural industries and 1.8 million in agriculture.
- Women are needed to provide the bulk of additions to the U.S. labor force
June 1943 p. 3, The Business Situation - In 1943, women hold 32 percent of civilian jobs
December 1943 p. 3, Employment, Hours, and Earnings - Including 14.1 million in nonagricultural industries and 1.8 million in agriculture
June 1943 p. 3, The Business Situation
![]()
Survey clippings
- August 1942 p. 10, National Income and the War Effort—First Half of 1942
- May 1944 p. 3, Estimated Civilian Labor Force
Photograph
Library of Congress photo
Control Number: 2017872126
Rationing
Civilians continue to experience inconveniences: car production stops and tinned pork and beans sales are prohibited (1942); the cost of living rises 6 percent (1942–43); and 128,760,419 War Ration Book Fours are issued (February 1944).
- Civilians continue to experience inconveniences
December 1944 p. 4, The Business Situation - Car production stops
January 1942 p. 3, The Business Situation - Tinned pork and beans sales are prohibited (1942)
March 1942 p. 6, The Business Situation - The cost of living rises 6 percent (1942–43)
December 1944 p. 2, The Business Situation - 128,760,419 War Ration Book Fours are issued (February 1944)
March 1944 p. 4, The Business Situation
Survey clippings
- June 1942 p. 19, Price Ceilings and Wartime Control Over the American Economy
- June 1943 p. 6, Civilian Supply: Inventories
- March 1944, Table of Contents
Photograph
Library of Congress photo
Control Number: 2017696298
Industries Convert
Manufacturers are required to convert facilities for war production. By 1943, America achieves “full industrial mobilization for total war,” producing 19 million tons of new ships, 86,000 aircraft, and other military supplies.
- Manufacturers are required to convert facilities for war production
December 1941 p. 3 and p. 20, The Business Situation; January 1942 pp. 3–5, The Business Situation - By 1943, America achieves “full industrial mobilization for total war”
January 1944, p. 1, The American Economy in 1943 - Producing 19 million tons of new ships, 86,000 aircraft, and other military supplies
June 1943 pp. 10–22, State Income Payments in 1942; January 1944 p. 1, The American Economy in 1943
Survey clippings
- January 1944 p. 1, The American Economy in 1943
- October 1944 p. 15, Wartime Construction and Plant Expansion
Photograph
Library of Congress photo
Control Number: 2017692797
Postwar Economy
By 1948, reconverted industries reach new production marks as consumers replenish depleted stocks of durable goods. In fiscal 1949, the U.S. government provides $6.3 billion, or one-sixth of its total outlays, for foreign aid.
- By 1948, reconverted industries reach new production marks
August 1948 p. 8, National Product and Income in the Second Quarter of 1948, Trends of Manufactures - Consumers replenish depleted stocks of durable goods
December 1945 p. 5, The Business Situation, Passenger Cars; August 1948 p. 4, National Product and Income in the Second Quarter of 1948 - In fiscal 1949, the U.S. government provides $6.3 billion, or one-sixth of its total outlays, for foreign aid
November 1949 p. 8, Foreign Transactions of the U.S. Government in Fiscal 1949
Survey clippings
- October 1946 p. 10, Retail Sales and Consumer Income Since VJ-Day
- February 1949 p. 1, The Emerging Peacetime Economy
Photograph
Library of Congress photo
Control Number: 2008680919
The 1950s
Pent-Up Demand and Purchasing Power
Purchasing Power
Family formation influences a boom in housing construction. By June 1950, mortgages outstanding increase $3 billion, nearly eclipsing 1949's $4 billion increase. As disposable personal income rises $8 billion, more automobiles are sold in spring 1959.
- Family formation influences a boom in housing construction
March 1950 p. 8, Family Formation and the Demand for Residential Construction; September 1950 p. 8, Construction Activity Continues to Expand - By June 1950, mortgages outstanding increase $3 billion, nearly eclipsing 1949's $4 billion increase
September 1950 p. 9, Residential Mortgage Debt at New High - Disposable personal income rises $8 billion
August 1959 p. 3, Consumer Income and Outlay - More automobiles are sold in spring 1959
August 1959 p. 2, Credit Demands Increase; December 1959 p. S–17, Finance
![]()
Survey clippings
- September 1950 p. 8, Construction Activity Continues to Expand
- May 1955 p. 13, The Housing Market
Photograph
Alamy stock photo
Image ID: AAKR7W
Defense
Military aid rises to $4.4 billion in 1953 during the Korean conflict. In 1958, defense expenditures abroad peak at $3.4 billion while defense purchases abroad comprise one-sixth of all U.S. purchases of goods and services from foreign countries.
- Military aid rises to $4.4 billion in 1953 during the Korean conflict
October 1953 p. 15, United States Foreign Aid in the Fiscal Year 1953 - In 1958, defense expenditures abroad peak at $3.4 billion while defense purchases abroad comprise one-sixth of all U.S. purchases of goods and services from foreign countries
November 1959 p. 15, Defense Expenditures Abroad, Major Item in the Balance of International Payments
Survey clippings
- August 1950 p. 1, The Business Situation
- November 1959 p. 15, Defense Expenditures Abroad, Major Item in the Balance of International Payments
Photograph
CORBIS/Corbis via Getty Images photo
Editorial Number: 615306014
Travel
Tourist-class air transportation debuts in 1952. By 1955, more Americans fly to Europe than travel by sea and foreign travel spending is a record $1.6 billion. After 1959 statehood, local Alaskan and Hawaiian flights are included in airlines-transportation statistics.
- Tourist-class air transportation debuts in 1952
June 1953 p. 9, One Billion Travel Dollars Go Abroad - By 1955, more Americans fly to Europe than travel by sea
June 1956 p. 18, Expansion in Foreign Travel - Foreign travel spending is a record $1.6 billion
June 1956 p. 17, Expansion in Foreign Travel - After 1959 statehood, local Alaskan and Hawaiian flights are included in airlines-transportation statistics
November 1959 p. S–23, Transportation and Communications
Survey clippings
- June 1953 p. 9, One Billion Travel Dollars Go Abroad
- September 1955 p. 10, Record Expansion in Foreign Travel
Photograph
Getty Images photo
Editorial Number: 53272159
Strikes
Steelworker strikes in 1952, 1956, and 1959 impact the automobile industry, finished steel net exports, and personal income and gross national product estimates. Steel mills operate at 12 percent of rated capacity during the 1959 strike.
- Steelworker strikes in 1952
April 1952 p. 1, The Business Situation; July 1952 p. 2, Steel Output Falls Off - Steelworker strikes in 1956
October 1959 p. 7, Recent Changes in National Income and Corporate Profits - Steelworker strikes in 1959
September 1959 p. 1, The Business Situation - Impact the automobile industry
December 1959 pp. 1–2, The Business Situation - Impact finished steel net exports
December 1959 p. 11, Contraction of United States Merchandise Trade Surplus, Some Aspects of Foreign Competition in the United States and Abroad - Impact personal income estimates
September 1959 pp. 1 and 2, The Business Situation - Impact gross national product estimates
October 1959 p. 1, The Business Situation - Steel mills operate at 12 percent of rated capacity during the 1959 strike
September 1959 p. 2, The Business Situation
Survey clippings
- July 1952 p. 2, Steel Output Falls Off
- September 1959 p. 1, The Business Situation
Photograph
United Steelworkers Archive photo
Courtesy of Penn State Special Collections and Anthony Montana, United Steelworkers
The 1960s
Launching New Technologies and Social Programs
Space
In 1964, nearly half of a $3 billion increase in national defense purchases is for space exploration. National Aeronautics and Space Administration (NASA) devotes two-thirds of its $5 billion, 1966 budget to fund programs for manned space flight, like the Gemini and Apollo missions.
- In 1964, nearly half of a $3 billion increase in national defense purchases is for space exploration
February 1963 p. 11, Government Programs for Fiscal Years 1963 and 1964 - NASA devotes two-thirds of its $5 billion 1966 budget to fund programs for manned space flight, like the Gemini and Apollo missions
February 1965 p. 11, Small Rise in Space Outlays
![]()
Survey clippings
- November 1962 p. 1, Federal Government Purchases of Goods and Services
- February 1965 p. 11, Small Rise in Space Outlays
Photograph
NASA photo
Archive: Marshall Space Flight Center
Missiles
Missile production numbers 565,000 jobs in 1961 as the military shifts from steel-using materiel to fissionable-metal missiles. Antiballistic and land- and sea-based intercontinental ballistic missile orders rise substantially in 1969.
- Missile production numbers 565,000 jobs in 1961
April 1962 p. 5, Large Expansion in Missiles - The military shifts from steel-using materiel to fissionable-metal missiles
January 1962 p. 10, Patterns of Steel Output and Demand, Steel Declining Relative to Durable Goods - Antiballistic and land- and sea-based intercontinental ballistic missile orders rise substantially in 1969
February 1968 p. 15, Federal Programs for Fiscal 1969
Survey clippings
- April 1962 p. 5, The Business Situation, Large expansion in missiles
- February 1969 p. 17, Defense Department Budgetary Expenditures, Military Functions and Military Assistance, Fiscal Years, 1968–70
Photograph
Library of Congress photo
Control Number: 2012646995
Medicare
Medicare hospital insurance begins July 1, 1966, and in 1967, 92 percent of those 65 and older enroll. Medicare’s supplemental plan costs $3 a month; by June, nursing homes admit 200,000 seniors.
- Medicare hospital insurance begins July 1, 1966
February 1966 p. 8, Federal Programs for Fiscal 1967, Medicare benefits begin - In 1967, 92 percent of those 65 and older enroll
January 1968 p. 11, Government Expenditures and Receipts, Medicare transfers mount sharply - Medicare's supplemental plan costs $3 a month
August 1966 p. 6, Medicare in the National Income and Product Accounts, Treatment of Medicare in the National Accounts - By June, nursing homes admit 200,000 seniors
January 1968 p. 11, Government Expenditures and Receipts, Medicare transfers mount sharply
Survey clippings
- January 1968 p. 11, Government Expenditures and Receipts, Medicare transfers mount sharply
- August 1966 p. 6, Medicare in the National Income and Product Accounts, Treatment of Medicare in the National Accounts
Photograph
Alamy stock photo
Image ID: M44TM2
Great Society
To combat poverty, 1967 funding increases $1 billion for educational and economic opportunity programs, like Head Start and Job Corps, and reaches 1 million young people.
- 1967 funding increases $1 billion for educational and economic opportunity programs, like Head Start and Job Corps, and reaches 1 million young people
February 1964 p. 11, Government Programs for Fiscal 1964 and 1965; October 1965 p. 5, Recent Changes in the Labor Market; February 1966 p. 17, The Federal Program for Fiscal 1967
Survey clippings
- February 1965 p. 12, Federal Grants-in-Aid to State and Local Governments
- February 1966 p. 17, The Federal Program for Fiscal 1967
Photograph
Library of Congress photo
Control Number: 2009632170
The 1970s
Responding to Fossil Fuel Challenges
Oil Prices
The 1973–74 Arab oil embargo quadruples imported crude oil prices, causing “one of the most severe shocks to the world economy.” In 1979, Iran's oil production is disrupted and the Organization of Petroleum Exporting Countries (OPEC) continues raising prices—16 percent in July alone.
- The 1973–74 Arab oil embargo quadruples imported crude oil prices
February 1978 p. 18, Work-Force Migration Patterns 1970–76; April 1978 p. 21, OPEC Transactions in the U.S. International Accounts, 1972–77 - Causing one of the most severe shocks to the world economy
April 1978 p. 21, OPEC Transactions in the U.S. International Accounts, 1972–77 - In 1979, Iran's oil production is disrupted and OPEC continues raising prices—16 percent in July alone
October 1979 p. 1, The Business Situation
![]()
Survey clippings
- April 1978 p. 21, OPEC Transactions in the U.S. International Accounts, 1972–77
- December 1979 p. 22, Selected Transactions with Official Agencies
Photograph
Alamy stock photo
Image ID: 2BE4XDT
Compact Cars
Gasoline shortages and rising costs spur vehicle manufacturers to produce smaller, lighter cars with better fuel economy. In 1975, new models must meet Corporate Average Fuel Economy standards.
- Gasoline shortages and rising costs
October 1979 p. 7, The Business Situation; October 1979 p. 21, Motor Vehicles, Model Year 1979 - Spur vehicle manufacturers to produce smaller, lighter cars with better fuel economy
October 1978, pp. 8–10, Motor Vehicle Sales - In 1975, new models must meet Corporate Average Fuel Economy standards
February 1979 p. 16, Pollution Abatement and Control Expenditures in Constant and Current Dollars, 1972–77; October 1979 p. 21, Motor Vehicles, Model Year 1979
Survey clippings
- September 1974 p. 22, The Utilization of Manufacturing Capacity, March and June 1974
- October 1979 p. 22, Gasoline Prices
Photograph
Library of Congress photo
Control Number: 2003673999
Pollution
Of 22 industries, petroleum has the largest average annual increase in pollution abatement spending—17 percent—from 1973 to 1978. In 1979, petroleum comprises $1.4 billion of the $7.3 billion industries plan to spend to reduce pollutants.
- Of 22 industries, petroleum has the largest average annual increase in pollution abatement spending—17 percent—from 1973 to 1978.
June 1979 p. 22, Capital Expenditures by Business for Pollution Abatement, 1977, 1978, and Planned 1979 - In 1979, petroleum comprises $1.4 billion of the $7.3 billion industries plan to spend to reduce pollutants
June 1979 p. 20, Capital Expenditures by Business for Pollution Abatement, 1977, 1978, and Planned 1979
Survey clippings
- July 1974 p. 58, Pollution Abatement Expenditures and the National Economic Accounts
- June 1978 p. 33, New Plant and Equipment Expenditures for Air, Water, and Solid Waste Pollution Abatement
Photograph
Alamy stock photo
Image ID: 2CWD058
Job Migration
Petroleum refiners and gas utilities invest in developing new oil and gas sources. From 1973 to 1976, 81,900 people migrate to Texas, many for oil and natural gas production jobs, and 14,200 migrate to Alaska to construct the Trans-Alaska Pipeline.
- Petroleum refiners and gas utilities invest in developing new oil and gas sources
April 1974 p. 46, 1974 Business Investment Plans Largely Unaffected by Energy Shortages - From 1973 to 1976, 81,900 people migrate to Texas, many for oil and natural gas production jobs, and 14,200 migrate to Alaska to construct the Trans-Alaska Pipeline
April 1972 p. 22, State Projections of Income, Employment, and Population; October 1976 pp. 23–28, Work-Force Migration Patterns, 1960–73; February 1978 p. 20, Work-Force Migration Patterns, 1970–76
Survey clippings
- April 1975 p. 18, Cyclical Developments in State Personal Income
- February 1978 p. 17, Work-Force Migration Patterns, 1970–76
Photograph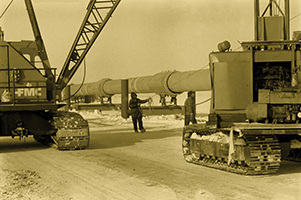
Alamy stock photo
Image ID: B58FC4
The 1980s
Enacting Change Through Economic Policies
Deficit
The $195.4 billion federal budget deficit in 1983 surpasses fiscal 1982's “largest deficit in history” as defense spending soars. The Balanced Budget and Emergency Deficit Control Act (1985) raises the federal debt limit to avoid default.
- The $195.4 billion federal budget deficit in 1983 surpasses fiscal 1982's largest deficit in history
March 1984 p. 19, Anatomy of a Federal Government Deficit, Fiscal Year 1983 - Defense spending soars
March 1982 p. 19, Federal Fiscal Programs; November 1982 p. 4, Special Note, National Defense Purchases; February 1983 p. 8, Federal Fiscal Programs; November 1984 p. 11, National Defense Spending: A Review of Appropriations and Real Purchases; February 1985 p. 10, Federal Fiscal Programs; May 1985 pp. 25–32, Sources of Change in the Federal Government Deficit, 1970–86 - The Balanced Budget and Emergency Deficit Control Act (1985) raises the federal debt limit to avoid default
February 1986 p. 26, Federal Fiscal Programs; February 1986 p. 32, Reducing the Federal Government Deficit: An Update
![]()
Survey clippings
- March 1984 p. 19, Anatomy of a Federal Government Deficit, Fiscal Year 1983
- February 1986 p. 32, Reducing the Federal Government Deficit: An Update
Photograph
Alamy stock photo
Image ID: E1C43C
Drought
Farmers face droughts and falling commodity prices and land values. The Agriculture and Food Act (1981) costs $49 billion more than estimated. The Food Security Act (1985) anticipates spending another $100.6 billion on farm programs.
- Farmers face droughts and falling commodity prices and land values
May 1985 p. 36, Patterns of Growth in Metropolitan and Nonmetropolitan Areas: An Update; August 1988 p. 1, Effects of the Drought on Farm Output; October 1988 pp. 1–6, The Business Situation - The Agriculture and Food Act (1981) costs $49 billion more than estimated
April 1986 p. 31, Federal Farm Programs for 1986–90 - The Food Security Act (1985) anticipates spending another $100.6 billion on farm programs
April 1986 p. 31, Federal Farm Programs for 1986–90
Survey clippings
- August 1988 p. 1, Effects of the Drought on Farm Output
- October 1988 p. 2, Select Farm Sector Measures
Photograph
Alamy stock photo
Image ID: CMRGA4
Taxes
The Economic Recovery Tax Act (1981), the Tax Equity and Fiscal Responsibility Act (1982), and the Tax Reform Act (1986) significantly change the U.S. tax code. The individual top tax rate in 1988 is the lowest since 1931.
- The Economic Recovery Tax Act (1981)
March 1987 p. 18, The Tax Reform Act of 1986 - Tax Equity and Fiscal Responsibility Act (1982)
March 1984 p. 20, Anatomy of a Federal Government Deficit, Fiscal Year 1983; May 1985 p. 24, Federal Personal Income Taxes: Liabilities and Payments, 1981–83 - Tax Reform Act (1986)
December 1986 p. 2, Retroactive Effects of the Tax Reform Act of 1986 on the National Income and Product Accounts Estimates; February 1987 pp. 19–28, Federal Fiscal Programs; March 1987 p. 18, The Tax Reform Act of 1986; November 1988 pp. 1–2, The Business Situation; October 1989 p. 25, Receipts and Expenditures of State Governments and of Local Governments: Revised and Updated Estimates, 1985–88; October 1989 p. 29, Regional Perspectives - Significantly change the U.S. tax code
March 1987 p. 18, The Tax Reform Act of 1986 - The individual top tax rate in 1988 is the lowest since 1931
March 1987 p. 18, The Tax Reform Act of 1986
Survey clippings
- April 1984 p. 10, Effects of the Economic Recovery Tax Act (ERTA) of 1981 and the Tax Equity and Fiscal Responsibility Act (TEFRA) of 1982 on Corporate Profits Taxes
- March 1987 p. 18, The Tax Reform Act of 1986
Photograph
Alamy stock photo
Image ID: RR1178
Savings & Loan
Thrift savings institutions succumb to interest-rate hikes and inflation. The Financial Institutions Reform, Recovery, and Enforcement Act (1989) tackles 511 thrift savings institution insolvencies. The bailout's estimated cost: $150 billion to $160 billion.
- Thrift savings institutions succumb to interest-rate hikes and inflation
May 1981 p. 4, Consumer installment credit; May 1981 p. S–17, Finance; August 1985 pp. 12–16, Consumer Installment Credit, 1980–85; December 1989 p. 2, NIPA Treatment of the “Bailout” of Thrift Institutions - The Financial Institutions Reform, Recovery, and Enforcement Act (1989) tackles 511 thrift savings institution insolvencies
December 1989 p. 2, NIPA Treatment of the “Bailout” of Thrift Institutions - The bailout's estimated cost: $150 billion to $160 billion
December 1989 p. 2, NIPA Treatment of the “Bailout” of Thrift Institutions
Survey clippings
- August 1985 pp. 12–16, Consumer Installment Credit 1980–85
- December 1989 p. 2, NIPA Treatment of the “Bailout” of Thrift Institutions
Photograph
Alamy stock photo
Image ID: ET1YD1
The 1990s
Statistical Strides in a Fast-Paced World
Data Branch Out
On Earth Day 1993, the President prioritizes “green GDP” to measure the costs of investing in and depleting environmental assets. Work begins on the Integrated Economic and Environmental Satellite Accounts, intended to supplement the national accounts but later discontinued.
- On Earth Day 1993, the President prioritizes “green GDP” to measure the costs of investing in and depleting environmental assets
April 1994 p. 34, Integrated Economic and Environmental Satellite Accounts - Work begins on the Integrated Economic and Environmental Satellite Accounts, intended to supplement the national accounts but later discontinued
April 1994 pp. 33–49, Integrated Economic and Environmental Satellite Accounts
![]()
Survey clippings
- April 1994 p. 33, Integrated Economic and Environmental Satellite Accounts
- November 1999 p. 44, Assessing BEA's Prototype Integrated Economic and Environmental Satellite Account
Photograph
Alamy stock photo
Image ID: BYD4DX
Cold War Ends
Defense spending is reduced and hundreds of U.S. military bases close or realign in 1991, 1993, and 1995. From 1993 to 1999, 25 percent of civilian defense support positions are outsourced or privatized.
- Defense spending is reduced
March 1992 p. 29, Federal Budget Estimates, Fiscal Year 1993; April 1993 p. 46, Federal Budget Estimates, Fiscal Year 1994; February 1994 p. 34, Federal Budget Estimates, Fiscal Year 1995 - Hundreds of U.S. military bases close or realign in 1991, 1993, and 1995. From 1993 to 1999, 25 percent of civilian defense support positions are outsourced or privatized
February 1995 p. 7, The Business Situation; April 1995 p. 66, Percent Change in Selected Shares of Personal Income, 1993–94; March 1998 p. 9, Federal Budget Estimates, Fiscal Year 1999
Survey clippings
- February 1994 p. 35, Budget Outlays by Function
- March 1998 p. 9, Federal Budget Estimates, Fiscal Year 1999
Photograph
Alamy stock photo
Image ID: TWH733
Bigger Bytes
A 1994 surge in computer-related goods is reflected in third- and fourth-quarter gross domestic product (GDP). In 1995, domestic shipments of memory chips are $11.1 billion as computers continue sparking changes in global financial markets.
- A 1994 surge in computer-related goods is reflected in third- and fourth-quarter GDP
February 1995 p. 2, The Business Situation - In 1995, domestic shipments of memory chips are $11.1 billion
February 1998 p. 8, Price Indexes for Selected Semiconductors, 1974–96 - Computers continue sparking changes in global financial markets
July 1990 p. 8, The U.S. National Income and Product Accounts: Revised Estimates and Tables; September 1990 p. 30, Capital Expenditures by Majority-Owned Foreign Affiliates of U.S. Companies, 1991; March 1991 pp. 41–42, U.S. International Transactions, Fourth Quarter and Year 1990
Survey clippings
- February 1998 p. 8, Price Indexes for Selected Semiconductors, 1974–96
- August 1999 p. 7, A Preview of the 1999 Comprehensive Revision of the National Income and Product Accounts
Photograph
Alamy stock photo
Image ID: 2F7D2W8
Smaller World
The 1994 North American Free Trade Agreement and the 1997 North American Industry Classification System reflect increasing globalization and partnership between the United States, Canada, and Mexico.
- 1994 North American Free Trade Agreement
November 1993 p. 46, Economic Concepts for Economic Classifications - 1997 North American Industry Classification System
June 1996 p. 53, BEA's Mid-Decade Strategic Plan: A Progress Report, New and improved measures; August 1999 p. 24, New Industry Classifications - Increasing globalization and partnership between the United States, Canada, and Mexico
June 1996 p. 53, BEA's Mid-Decade Strategic Plan: A Progress Report, New and improved measures; August 1999 p. 24, New Industry Classifications
Survey clippings
- November 1993 p. 46, Economic Concepts for Economic Classifications
- June 1999 p. 16, Outlays for New Investment in the United States by Foreign Direct Investors, 1980–98
Photograph
Alamy stock photo
Image ID: M17NCE
The 2000s
Loss Lays the Groundwork for Recovery
9/11
The September 11, 2001, terrorist attacks destroy $14 billion in private business and $1.5 billion in state and local government enterprise value of assets. Insurance benefits payments are $40 billion; airlines receive a $20 billion subsidy.
- The September 11, 2001, terrorist attacks destroy $14 billion in private business and $1.5 billion in state and local government enterprise value of assets
November 2001 pp. 2–3, The Terrorist Attacks of September 11th as Reflected in the National Income and Product Accounts - Insurance benefits payments are $40 billion
December 2001 p. 14, Corporate Profits - Airlines receive a $20 billion subsidy
November 2001 pp. 2–3, The Terrorist Attacks of September 11th as Reflected in the National Income and Product Accounts
![]()
Survey clippings
- November 2001 pp. 2–3, The Terrorist Attacks of September 11th as Reflected in the National Income and Product Accounts
- January 2002 p. 31, Effects of September 11th Terrorist Attacks on U.S. International Transactions
Photograph
Alamy stock photo
Image ID: 2D3NJNX
Hurricanes
Hurricanes Katrina, Rita, and Wilma strike the Gulf Coast in 2005. Third-quarter corporate profits are reduced $75.2 billion for fixed assets damages. In 2006, the Gulf Coast's construction sector boosts Louisiana's personal income growth.
- Hurricanes Katrina, Rita, and Wilma strike the Gulf Coast in 2005
December 2005 p. 4, The Impact of the Third-Quarter Hurricanes on the NIPAs - Third-quarter corporate profits are reduced $75.2 billion for fixed assets damages
December 2005 p. 4, The Impact of the Third-Quarter Hurricanes on the NIPAs - In 2006, the Gulf Coast's construction sector boosts Louisiana's personal income growth
September 2007 pp. 116–117, Personal Income for Metropolitan Areas for 2006
Survey clippings
- September 2005 p. iv, Taking Account
- December 2005 p. 4, The Impact of the Third-Quarter Hurricanes on the NIPAs
Photograph
Alamy stock photo
Image ID: G3YTPY
Housing
The housing bubble bursts, real estate prices decline, and credit markets freeze up. In 2008, the Treasury Department commits to purchasing up to $100 billion of senior preferred stock in government-sponsored enterprises Fannie Mae and Freddie Mac.
- The housing bubble bursts, real estate prices decline, and credit markets freeze up
January 2009 p. 66, Housing Prices - In 2008, the Treasury Department commits to purchasing up to $100 billion of senior preferred stock in government-sponsored enterprises Fannie Mae and Freddie Mac
February 2009 p. 7, The 2008 Financial Crisis and the National Accounts
Survey clippings
- January 2009 p. 66, Housing Prices
- February 2009 p. 7, The 2008 Financial Crisis and the National Account
Photograph
Alamy stock photo
Image ID: CD5BMY
Recession
American Recovery and Reinvestment Act (ARRA) aims to pull the country out of the Great Recession (December 2007 to June 2009). Estimated to cost $825.4 billion over 10 years, ARRA provisions include reducing taxes and investing in energy efficiency, infrastructure, and science.
- ARRA aims to pull the country out of the Great Recession (December 2007 to June 2009)
April 2008 p. 1, GDP and the Economy Final Estimates for the Fourth Quarter of 2007; June 2009 p. 17, American Recovery and Reinvestment Act of 2009 - Estimated to cost $825.4 billion over 10 years
June 2009 p. 17, American Recovery and Reinvestment Act of 2009 - ARRA provisions include reducing taxes and investing in energy efficiency, infrastructure, and science
December 2009 pp. 11–14, American Recovery and Reinvestment Act of 2009
Survey clippings
- June 2009 pp. 17, American Recovery and Reinvestment Act of 2009
- December 2009 p. 14, American Recovery and Reinvestment Act of 2009
Photograph
Alamy stock photo
Image ID: D0743H
The 2010s
Economic Expansion
Uninterrupted Growth
The nation's 2010 real gross domestic product (GDP) increases at a 3.0 percent annual rate, ushering in a decade of economic expansion—the longest ever recorded.
- The nation's 2010 real gross domestic product (GDP) increases at a 3.0 percent annual rate
August 2011 pp. 6–7, Annual Revision of the National Income and Product Accounts Annual Estimates for 2003–2010 Quarterly Estimates for 2003:I–2011:I - Ushering in a decade of economic expansion—the longest ever recorded
August 2014 p. 6, Table 2. Real Gross Domestic Product (GDP); August 2015 p. 6, Table 2. Real Gross Domestic Product (GDP); August 2020 p. 7, Table 2. Real Gross Domestic Product (GDP)
![]()
Survey clippings
- April 2011 p. 1, GDP and the Economy
- July 2019, Real GDP: Percent Change From Preceding Quarter
Photograph
Alamy stock photo
Image ID: R238NM
Health Care
The Affordable Care Act (ACA) is signed into law in 2010 and takes effect in 2014. Tax credits to assist individuals buying health insurance through ACA public exchanges boost government social benefits to persons by 35.2 percent in first-quarter 2015.
- The ACA is signed into law in 2010 and takes effect in 2014
June 2014 p. 1, BEA Briefing: Affordable Care Act Transactions in the National Income and Product Accounts - Tax credits to assist individuals buying health insurance through ACA public exchanges boost government social benefits to persons by 35.2 percent in first-quarter 2015
June 2015 p. 2, Federal Government Current Receipts and Expenditures
Survey clippings
- September 2010 p. 42, Research Spotlight: A Reconciliation of Health Care Expenditures in the National Health Expenditures Accounts and in Gross Domestic Product
- June 2014 p. 1, BEA Briefing: Affordable Care Act Transactions in the National Income and Product Accounts
Photograph
Alamy stock photo
Image ID: 2CY6ANA
Shutdowns
A partial federal government shutdown from December 22, 2018, to January 25, 2019, lasts longer than one in October 2013. Employees are furloughed; January's Survey doesn't publish; and the first GDP fourth-quarter 2018 estimate's release is delayed.
- A partial federal government shutdown from December 22, 2018, to January 25, 2019
March 2019 Note on the Effects of the Partial Federal Government Shutdown on the Estimation of the Fourth Quarter of 2018 - Employees are furloughed
March 2019 Note on the Effects of the Partial Federal Government Shutdown on the Estimation of the Fourth Quarter of 2018 - January's Survey doesn't publish
January 2019, Contents; February 2019, Director's Message - The first GDP fourth-quarter 2018 estimate's release is delayed
March 2019 Director's Message; March 2019 GDP and the Economy Initial Estimates for the Fourth Quarter of 2018
Survey clippings
- January 2019, Notice
- March 2019 GDP and the Economy Initial Estimates for the Fourth Quarter of 2018
Photograph
Alamy stock photo
Image ID: RFB56F
Territories
GDP statistics for American Samoa, the Commonwealth of the Northern Mariana Islands (CNMI), Guam, and the U.S. Virgin Islands debut in 2010. The long-term goal is to integrate the four U.S. territories' data into the full set of U.S. national accounts.
- GDP statistics for American Samoa, the CNMI, Guam, and the U.S. Virgin Islands debut in 2010
September 2010 p. 34, BEA Briefing: GDP for American Samoa, the Commonwealth of the Northern Mariana Islands, Guam, and the U.S. Virgin Islands - The long-term goal is to integrate the four U.S. territories’ data into the full set of U.S. national accounts
December 2014 p. 2, Future Directions
Survey clippings
- February 2018, Territorial Economic Accounts for American Samoa, the Commonwealth of the Northern Mariana Islands, Guam, and the U.S. Virgin Islands
- September 2010 p. 34, BEA Briefing: GDP for American Samoa, the Commonwealth of the Northern Mariana Islands, Guam, and the U.S. Virgin Islands, Annual Estimates for 2002–2007
Photograph
Alamy stock photo
Image ID: ECRKMF